A Strong Start for College and Career


Summary
High school student participation in dual enrollment—a key strategy for increasing equitable access to postsecondary education and improving readiness for college—has been on the rise in California in recent years. Prior research indicates that 18.2 percent of the cohort graduating high school in 2019 participated in dual enrollment through a California community college during their four years of high school; this is up from just 11.3 percent of graduates in the 2016 graduating cohort.1 Despite the overall increase in participation, however, large gaps between racial/ethnic subgroups persist. Also of concern, English learners, socioeconomically disadvantaged students, youth in foster care, and students experiencing homelessness lag their peers in dual enrollment participation.2 To address these gaps, California policymakers and advocates are working with K–12 and community college educators to increase participation and to ensure that dual enrollment opportunities are more equitably available to students and accessed by them earlier in high school.
This infographic updates and expands our prior work by examining participation in dual enrollment among California public high school students at all grade levels. Our partnerships with the California Department of Education (CDE) and the California Community Colleges Chancellor’s Office (CCCCO) enable us to merge data from both segments and analyze the full extent of dual enrollment for California public high school students through the state’s 72 community college districts. While we have previously reported dual enrollment participation among high school graduates, this analysis incorporates new data to show rates of participation and characteristics for all 9th- through 12th-grade students during the 2021–22 academic year. For the first time, we have a statewide picture of dual enrollment participation for high school students at all grade levels to inform current policy discussions and efforts by local educational agencies (LEAs) and community colleges to increase dual enrollment. An appendix includes charts showing dual enrollment participation by grade level across counties.
Data and Methods
Our analysis relies on matched data from two sources:
- student-level enrollment data from CDE for the census of 9th through 12th graders enrolled in a California LEA (defined as a County Office of Education, a public school district, or a charter school) during the 2021–22 academic year;
- student-level course enrollment data from CCCCO between summer 2021 and spring 2022.
By merging data from both segments, we can identify all public high school students in Grades 9–12 who enrolled in community college courses, whether through formalized programs or independently.
Formalized dual enrollment occurs as the result of an agreement between an LEA and a community college. Such programs include, but are not limited to, College and Career Access Pathways (CCAP) programs, Early College High Schools, and Middle College High Schools. In this infographic, we compare dual enrollment participation in CCAP programs with non-CCAP participation, which includes both other formal programs and independent dual enrollment.
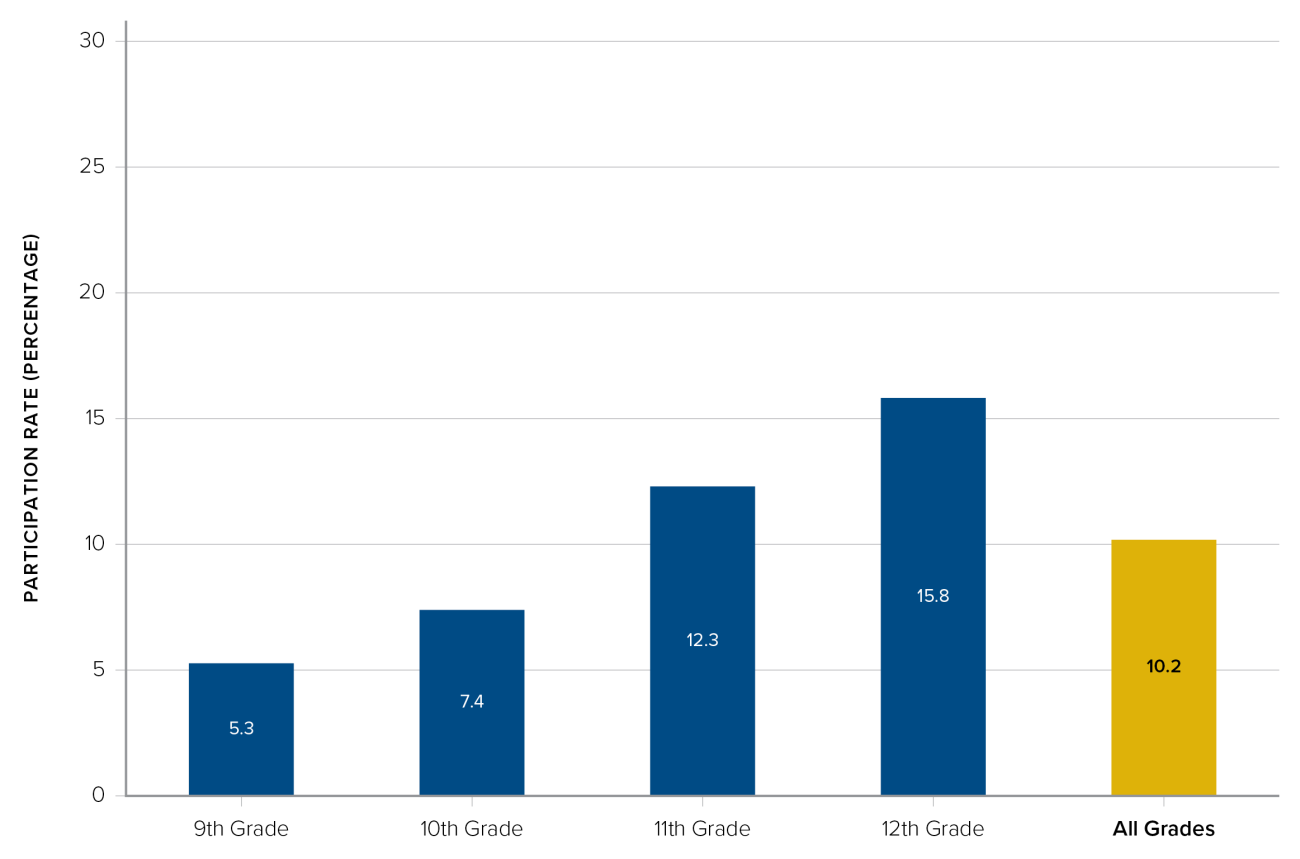
About 10 percent of all 9th through 12th graders attending public high schools in California enrolled in a community college course in 2021–22.
Participation rates rise steadily across grade levels as student awareness of opportunities, readiness for academic demands, and access may increase (Figure 1). Participation rates are lowest among 9th graders (just over 5 percent of students) and are highest among 12th graders (nearly 16 percent).
Figure 1. Dual Enrollment Participation by High School Grade Level, 2021–22
While dual enrollment participation is low overall for 9th grade, participation is more equitable across racial/ethnic subgroups than in later grades.
Among 9th graders, 7 percent of Asian American students participated in dual enrollment in 2021–22, compared to 5 percent of Latinx and White students and 3 percent of Black students (Figure 2). It is notable that as overall participation increases with grade-level progression, so does the gap between Asian American students’ participation and their peers from other racial/ethnic subgroups. Among 12th graders, 25 percent of Asian American students took at least one community college course, compared to 18 percent of White students, 15 percent of Latinx students, and 11 percent of Black students. The disparity in participation between Asian American and Black students, for example, is four percentage points in 9th grade and 14 percentage points in 12th grade. The reasons for such differences in participation include both institutional and individual factors, but the more equitable rates of participation in 9th grade are likely the result of formalized school-based programs (e.g., CCAP, Early College and Middle College High Schools, and articulation agreements). Figure 2 illustrates this finding: the patterned section of each bar represents the proportion of dually enrolled students in a particular subgroup that is CCAP students. The solid portion of the bar represents the proportion of dually enrolled students in a particular subgroup that is taking college courses independent of a CCAP agreement.
Figure 2. Dual Enrollment Participation by Grade Level and Racial/Ethnic Subgroup, 2021–22
In 9th and 12th grades, dual enrollment participation rates are similar for students identified as socioeconomically disadvantaged (SED) and their more affluent peers.
Among 9th graders, 5 percent of both SED students and non-SED students participated in dual enrollment in 2021–22 (Figure 3). As overall participation in dual enrollment increases in 10th and 11th grades, disparities between SED and non-SED students expand, with a gap of three percentage points among 10th graders and five percentage points in 11th grade. Interestingly, the pattern shifts in 12th grade, when dual enrollment rates for SED students are higher (14 percent) than non-SED students (12 percent). Although the disparities in participation in 10th and 11th grades should not be dismissed, the parity in 9th grade is promising and may be driven by intentional efforts to provide equitable opportunities early in high school.
Figure 3. Dual Enrollment Participation by Grade Level and Socioeconomic Status, 2021–22
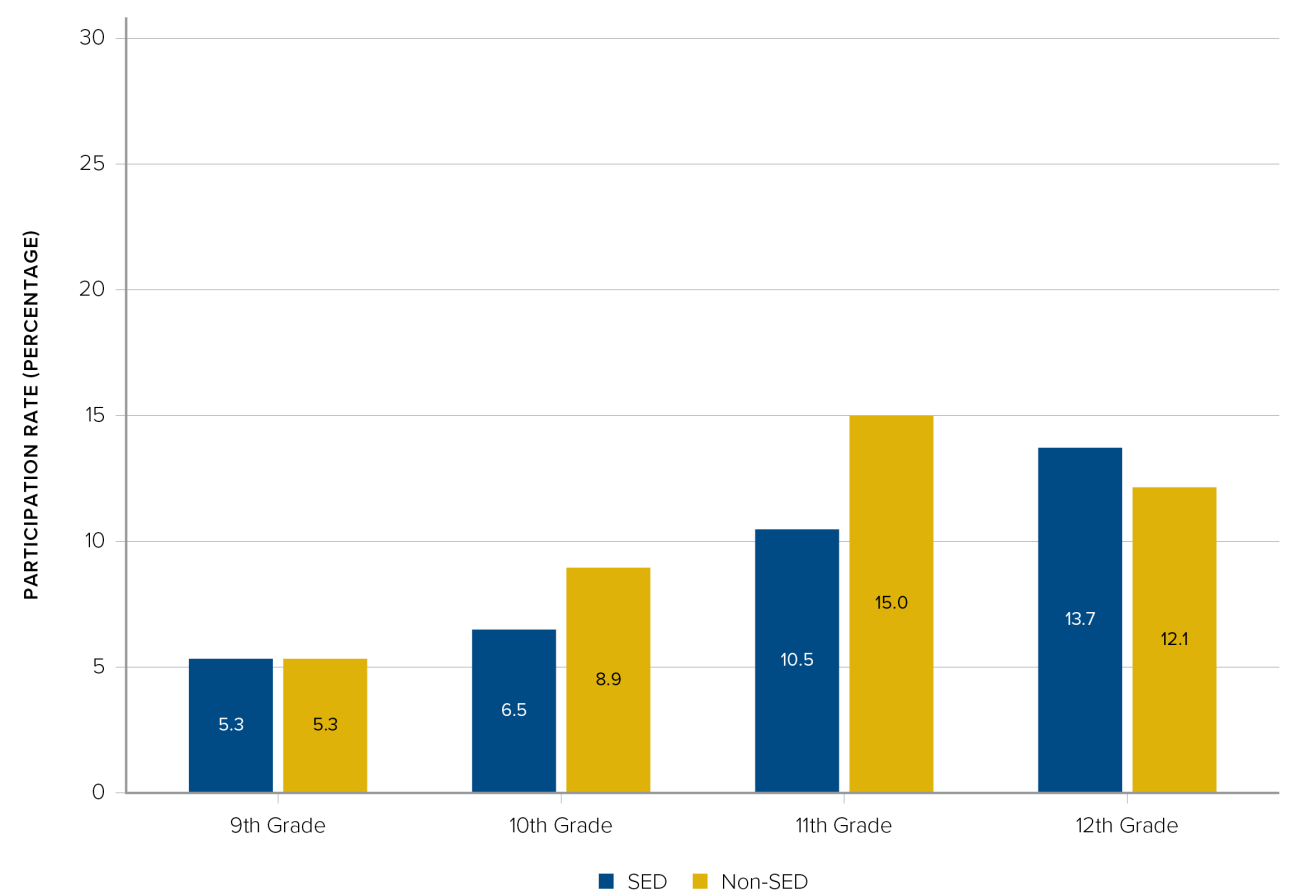
Note: CDE defines socioeconomically disadvantaged (SED) students as those who are eligible for free or reduced-price meals through the National School Lunch Program or who do not have a parent who has completed high school.
Opportunities for dual enrollment vary widely by county.
In Inyo and San Benito Counties, for example, just 2 percent of high school students took community college courses in 2021–22, compared to more than 25 percent in San Luis Obispo and Santa Barbara Counties (Figure 4).
In addition to the variation in overall participation rates, dual enrollment differs by grade level across counties. No 9th graders participated in dual enrollment in Amador, Madera, and Napa Counties in 2021–22, and only 1 percent participated in Imperial, Inyo, Modoc, San Benito, and San Diego Counties. By contrast, more than 30 percent of 9th graders in Plumas and Santa Barbara Counties took a community college course. San Benito (3 percent) and Colusa (5 percent) Counties had the lowest rates of 12th-grade dual enrollment whereas in Shasta and San Luis Obispo Counties, more than one third of high school seniors participated (see Figures A1–A4 in the appendix).
Counties with high rates of 9th-grade dual enrollment tend to have high rates of participation in all grade levels, which is likely the result of intentional efforts among K–12 and community college leaders to provide information and access. On the other hand, low rates of 9th-grade dual enrollment do not necessarily indicate lower overall participation. In Madera and Napa Counties, for example, virtually no 9th graders participated in dual enrollment, but 10 percent of high school students overall took a dual enrollment class— on par with the statewide average.
Figure 4. Dual Enrollment Participation for All High School Students Across Counties, 2021–22
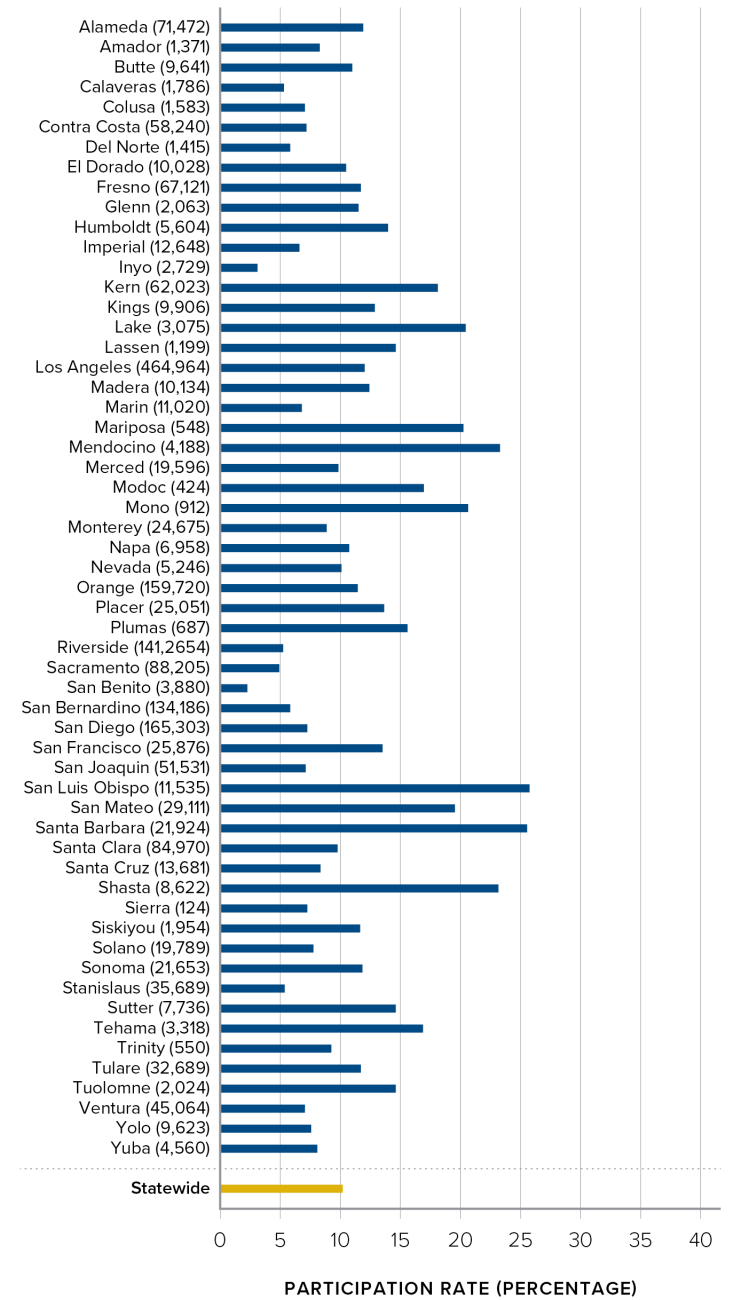
Note: Figure 4 excludes Alpine County as total high school enrollment does not meet cell-size reporting requirements. The total number of students in 9th through 12th grade in each county is provided in parentheses.
High school students access college courses at community colleges across the state.
Dually enrolled high school students in California are taking face-to-face and online courses through all 72 California Community College (CCC) districts (Figure 5). Where a high school student takes college classes depends on agreements between LEAs and community colleges, proximity and location, information and knowledge about enrollment procedures, and course availability, among other factors.
In many cases, students’ opportunities are not limited to a single community college. In counties with large urban centers, students are taking courses at a greater number of community colleges. In many counties, the number of community college districts serving high school students far exceeds the number of college districts physically located in the area, indicating that students are taking online courses at colleges across the state. For example, in Los Angeles County, high school students enrolled at nearly every community college district in the state (66 of the 72).
Figure 5. Number of Community College Districts in Which High School Students Enrolled in 2021–22, by County
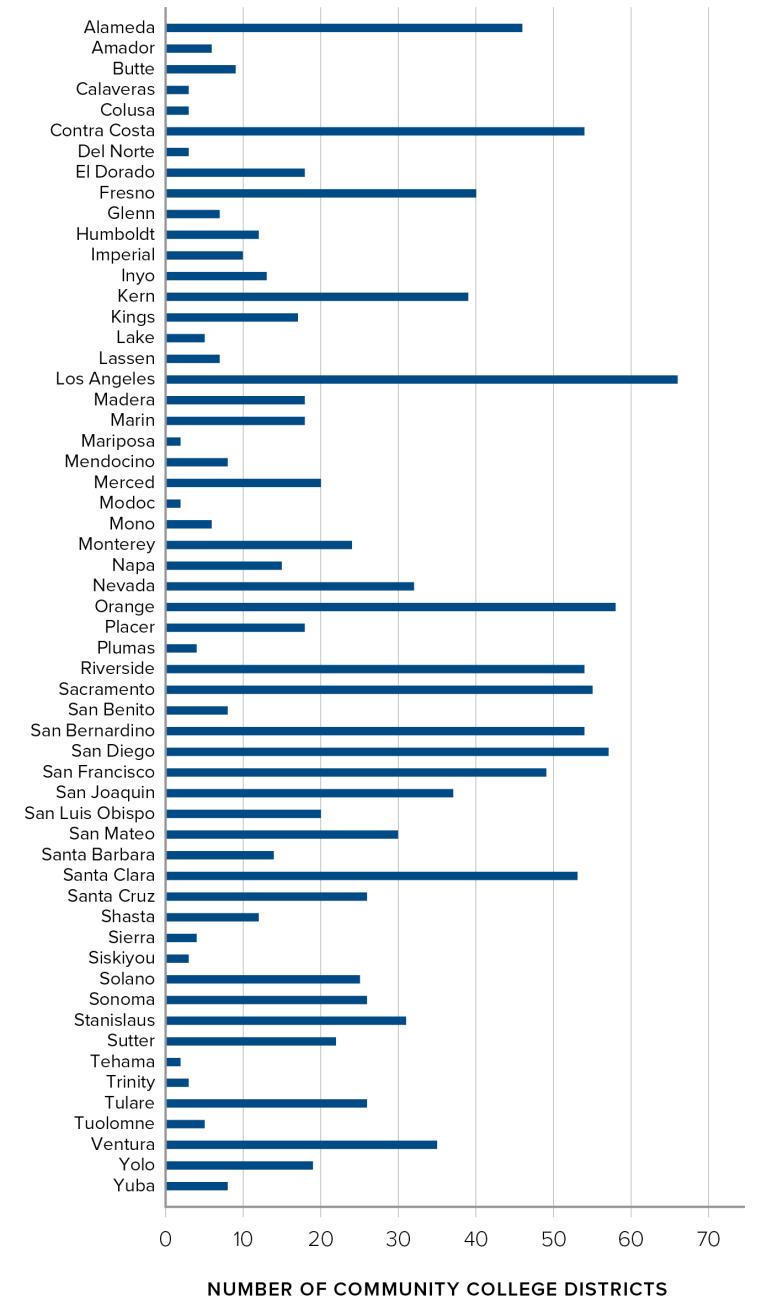
Note: Figure 5 includes 72 CCC districts and excludes Calbright College, which does not enroll any high school students. The figure also excludes Alpine County as total high school enrollment does not meet cell-size reporting requirements.
Across colleges, dual enrollment is not equally accessed by students at all grade levels.
Across community college districts, the grade-level composition of dual enrollment students differs (Figure 6). While the population of dually enrolled students is largely 11th and 12th graders (green and orange segments in Figure 6) across most colleges, in a few districts more than one third of dual enrollment students are 9th graders (blue segments in Figure 6). This suggests that early opportunities for high school students to participate in dual enrollment are unevenly distributed, leaving room for growth in communities where 9th and 10th graders currently comprise a smaller share of dually enrolled students.
Figure 6. Grade-Level Representation Among Dually Enrolled Students Across Community College Districts
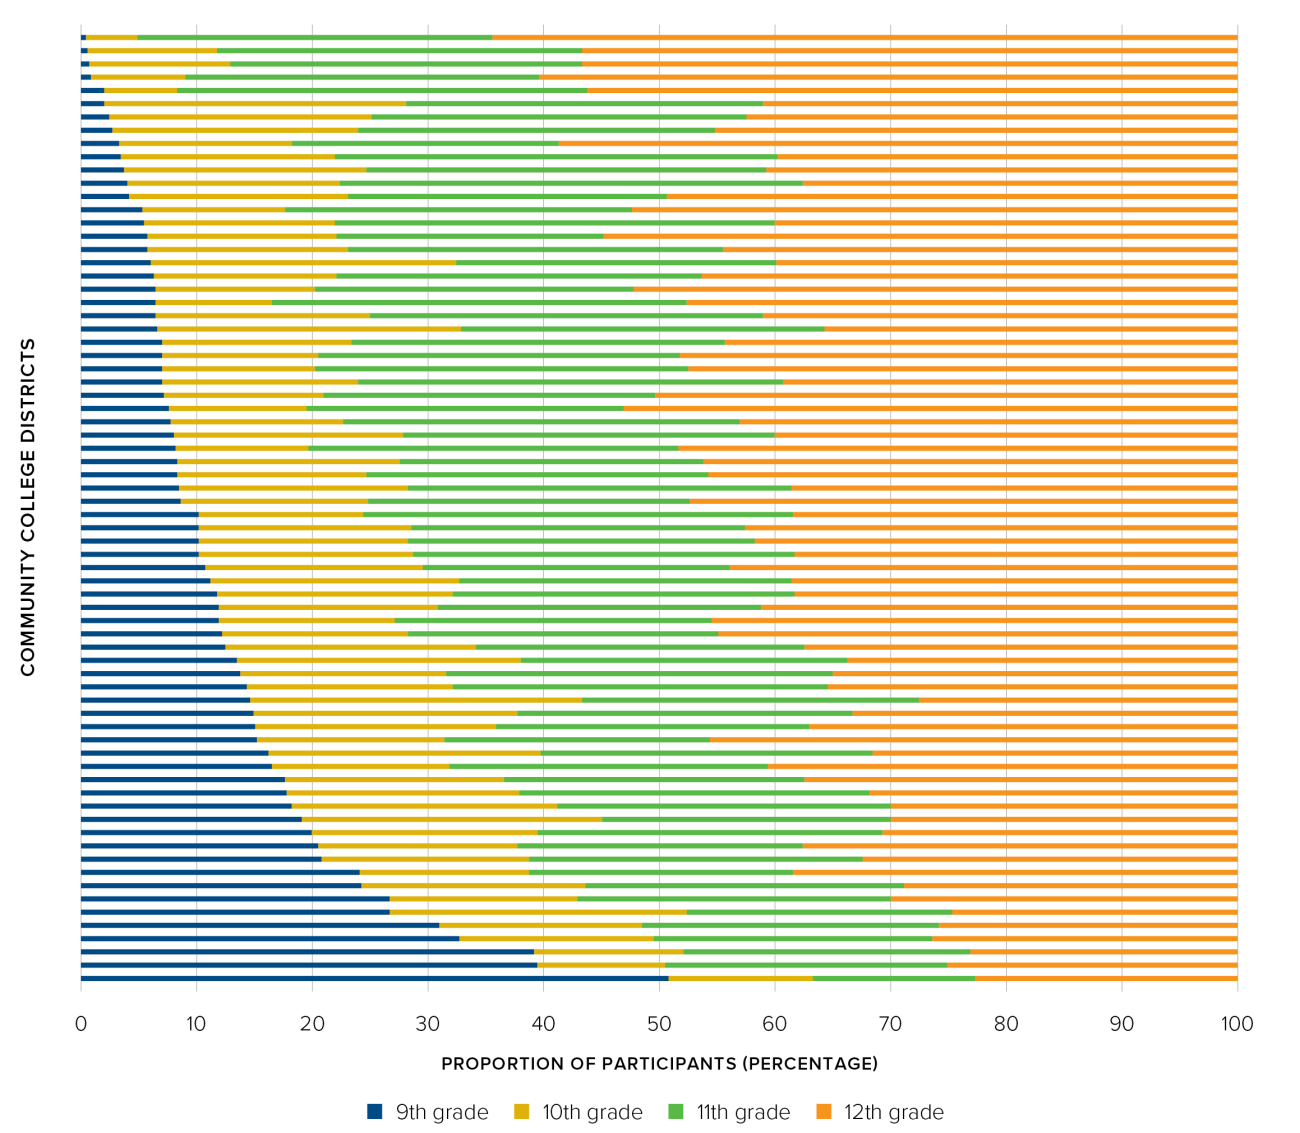
Note: Figure 6 includes 72 CCC districts and excludes Calbright College, which does not enroll any high school students.
Dual enrollment participation rates vary widely across LEAs.
Figure 7 shows that dual enrollment participation rates vary from zero (in 57 LEAs) to almost 100 percent of 9th through 12th graders. The highest rates of participation were observed in Early College and Middle College High Schools, where nearly all students take community college courses. Districts with no dual enrollment are small (six of the seven districts with the lowest participation have fewer than 60 students total in Grades 9–12) and all are located in remote, rural areas with limited physical access to college campuses. In addition, 29 charter schools and 16 County Offices of Education (COEs) do not have any students participating in dual enrollment. This pattern may change, however, as opportunities to participate in online dual enrollment become more widely available.
Figure 7. Dual Enrollment Participation by Local Educational Agency
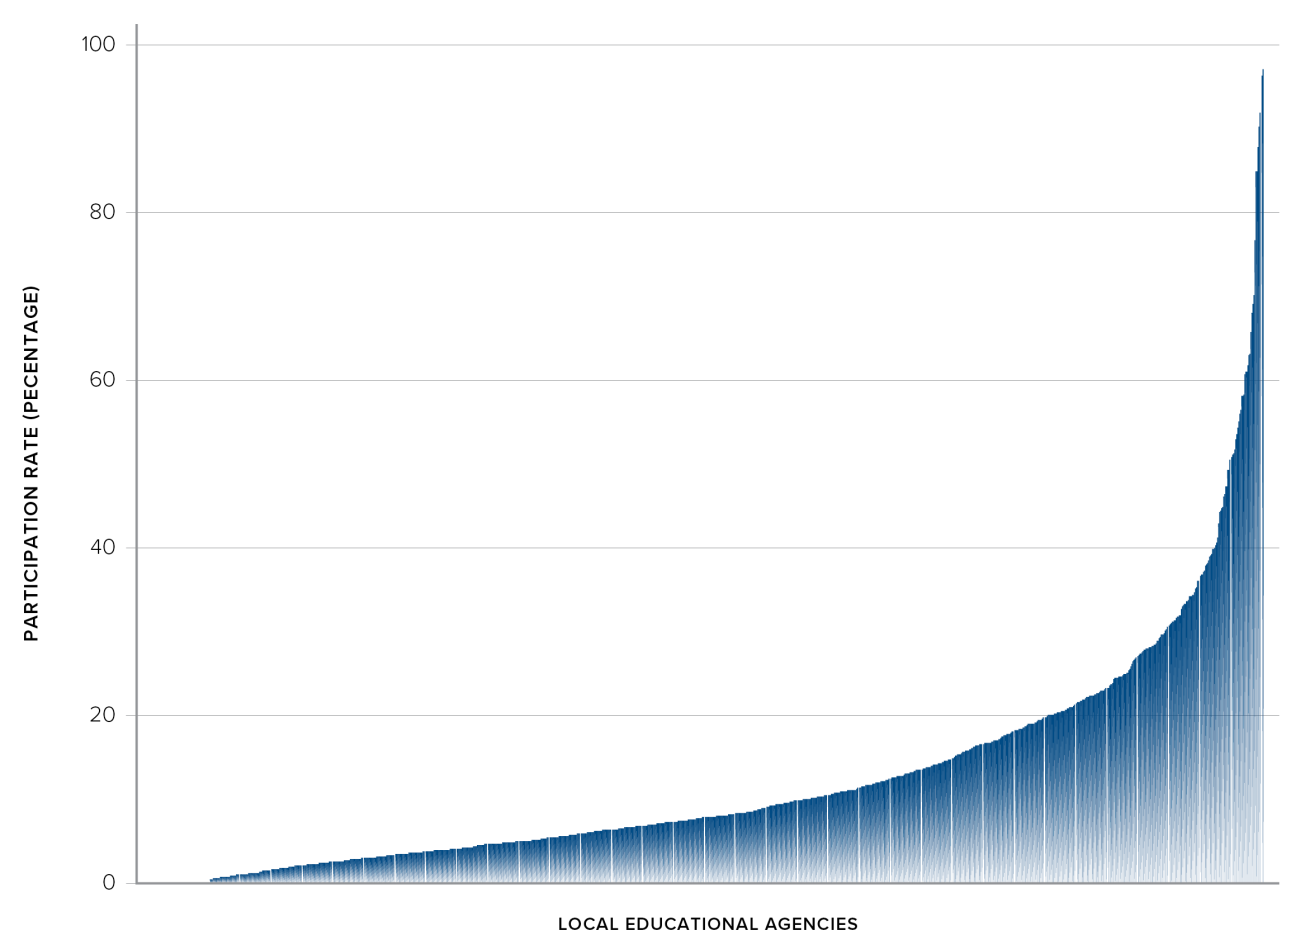
Note: The 1,065 LEAs represented here include 416 public unified and high school districts, 594 charter schools, and 55 COEs. COEs in Alpine, Modoc, and Sierra Counties are excluded due to cell-size reporting requirements. State special schools, elementary districts, and nonschool locations—across which only 40 students are taking community college courses—are also excluded.
High school students take community college courses in a variety of subject areas, and what they take differs by grade level.
Table 1 highlights dual enrollment course-taking patterns using student course-enrollment information. Unlike the previous figures, where rates of participation are based on the number of students, the rates of enrollment in a particular field of study are calculated using the total number of courses that students take. Among the 448,508 total CCC course enrollments by high school students in 2021–22, the courses most commonly taken were in interdisciplinary studies, including career orientation and academic guidance courses that introduce many students to college courses. Enrollment in these interdisciplinary courses decreases as grade level progresses: from 38.5 percent of courses taken by 9th graders to 13.9 percent of courses taken by 12th-grade dually enrolled students. After interdisciplinary studies, social sciences (14.7 percent) and humanities (12 percent) courses had the largest number of dual enrollment students across all grade levels. Just over 10 percent of all course enrollments were basic skills courses—many of which are related to services for special needs students, study skills, and GED preparation—with the highest enrollment among 9th and 10th graders and the lowest among 12th graders.
Notably, about 25 percent of community college courses taken by high school students are career technical education (CTE) courses, which span all subject areas and fields of study (see Table 1). While overall dual enrollment participation is lowest in 9th grade and highest in 12th grade, the proportion of course enrollments in CTE remains steady across grade levels (Figure 8). Among the close to 50,000 course enrollments of 9th graders in 2021–22, 24.3 percent were CTE courses, and 22.5 percent of the nearly 187,000 courses taken by 12th graders were CTE. Within CTE course-taking, the most popular classes were Administration of Justice (7.3 percent), Child Development/Early Care (6 percent), Office Technology/Office Computers (4.2 percent), Business and Commerce (3.6 percent), and Computer Programming (3.3 percent), with similar rates across grade levels. For 9th graders, the third most popular CTE courses were engineering technology courses; for 12th graders, courses in health occupations were also quite popular.
Table 1. Course Types and Fields of Study by Grade Level
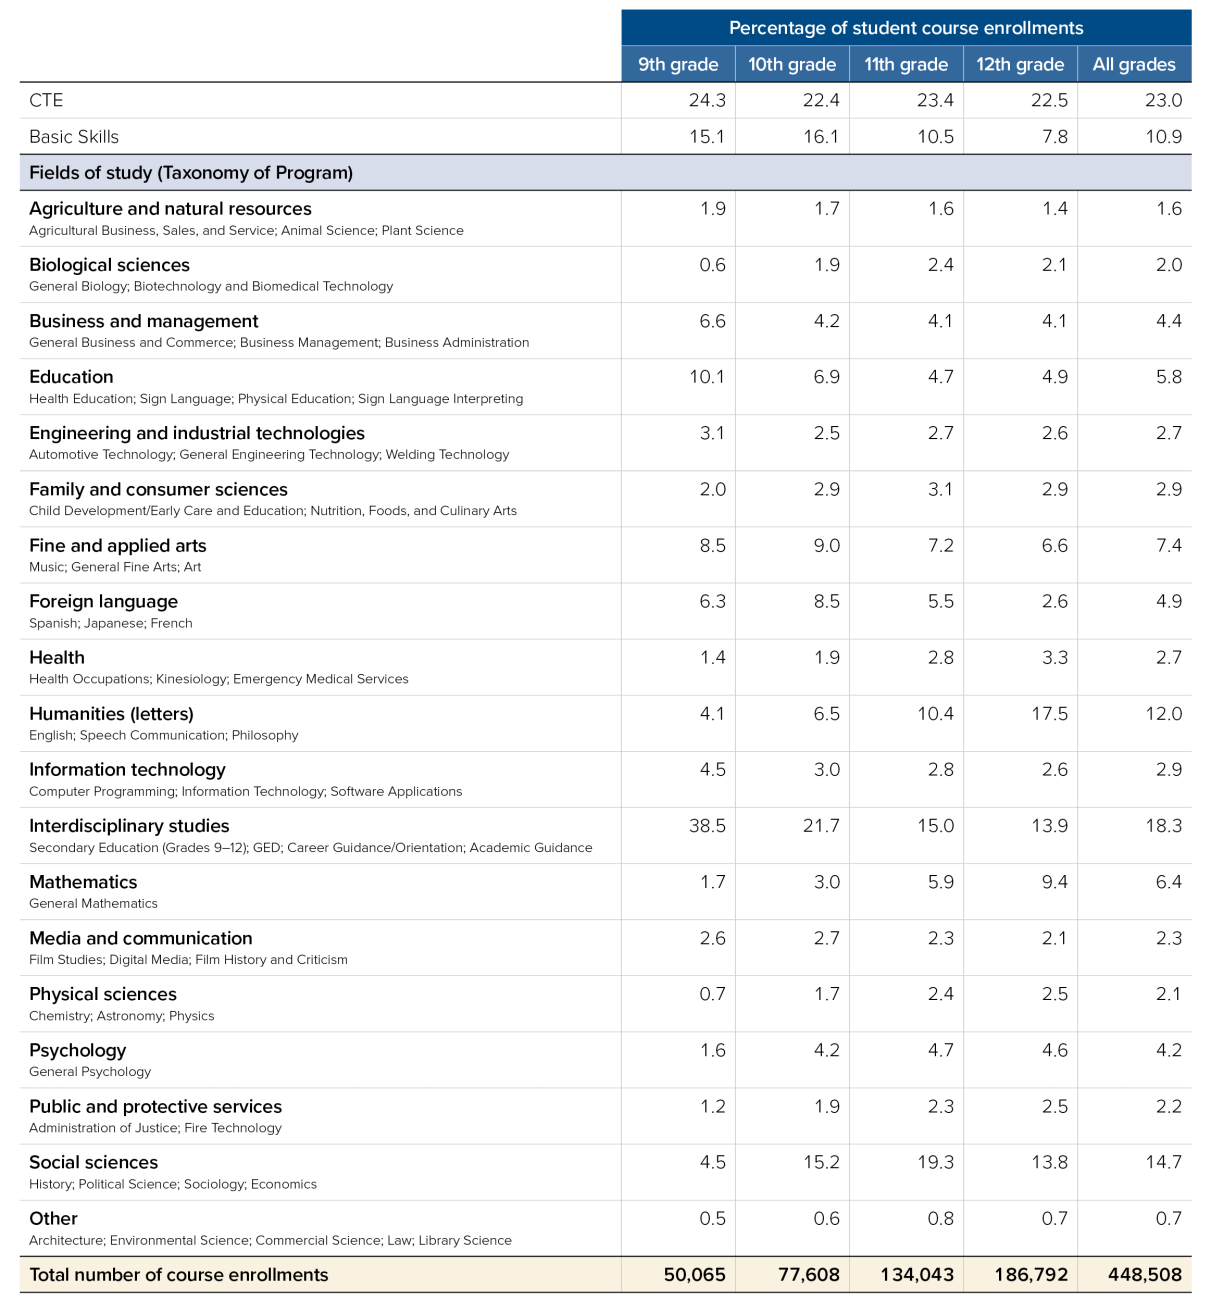
Note: The programs listed in this table leverage the first two digits of CCC’s Taxonomy of Program (TOP) codes, which correspond to the more commonly used Classification of Instructional Programs (CIP) codes distinguishing fields of study. The “other” category includes the five TOP codes with the smallest dual enrollment participation: architecture, environmental science, commercial science, law, and library science. The courses in each TOP code with the highest dual enrollment participation are listed underneath.
Figure 8. Proportion of Dual Enrollment Course-Taking in Career Technical Education (CTE)
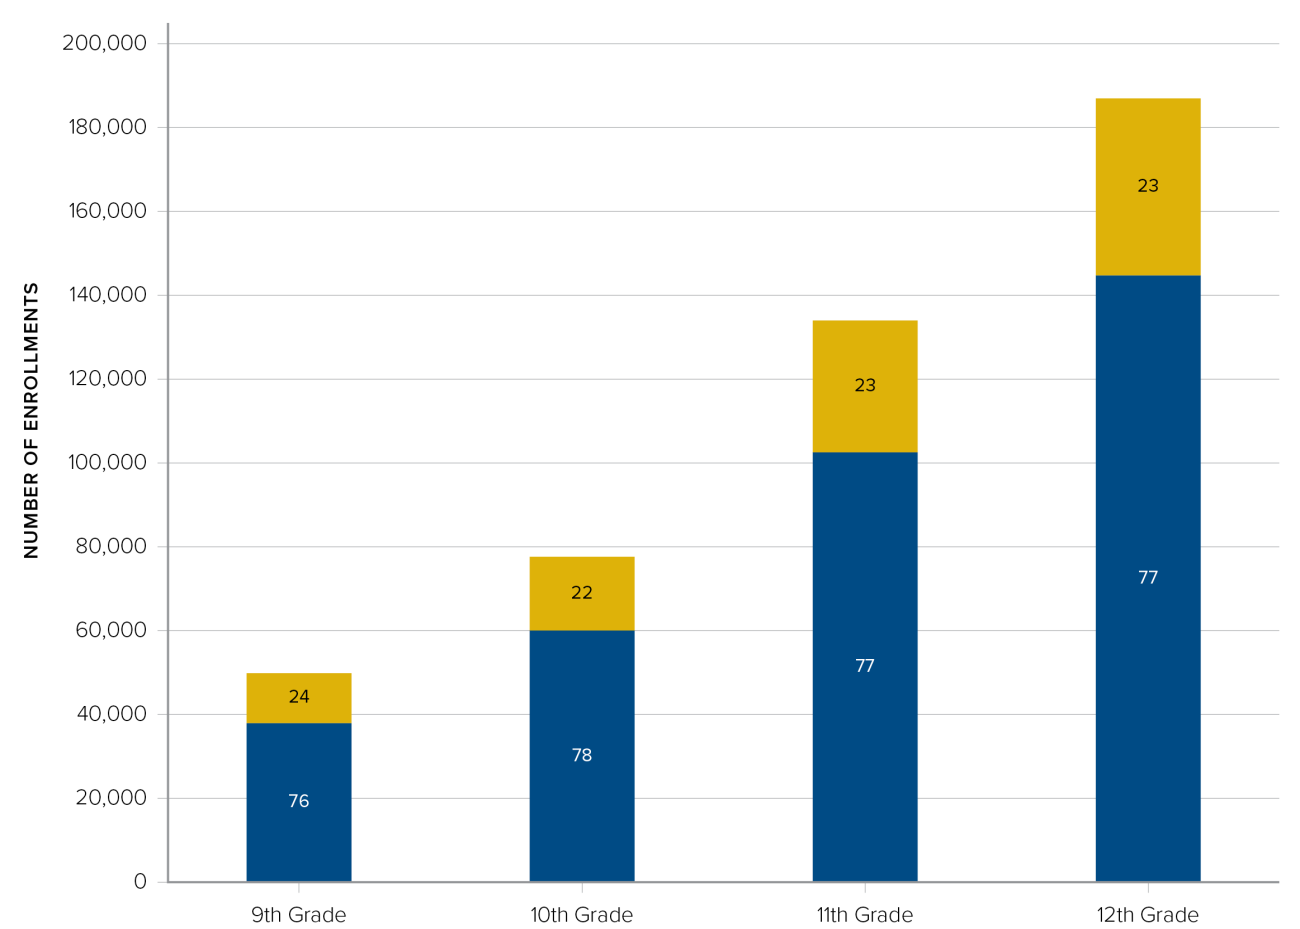
Note: Data labels in bars represent percentages of courses.
Conclusion
This analysis affirms prior findings that participation in dual enrollment is unequally distributed across racial and socioeconomic subgroups and geography. It also reveals new evidence about the potential of early access to dual enrollment in 9th grade to close educational equity gaps in participation. The analysis presented here indicates that participation in 9th-grade dual enrollment, which occurs largely through formalized partnerships between high schools and community colleges (such as CCAP agreements), is more equitable by race and socioeconomic status. This evidence, combined with prior research that found more equitable participation by race/ethnicity in community college classes enrolling only high school students, further emphasizes the power of robust partnerships and intentional placement of students for increasing equitable access to higher education.
This research was supported by the Institute of Education Sciences, U.S. Department of Education, through Grant R305A210217 to the Regents of the University of California. The California Education Lab, PACE, and Wheelhouse are grateful to College Futures Foundation, Stuart Foundation, and the Bill & Melinda Gates Foundation for their ongoing support as well as to the California Department of Education and the California Community Colleges Chancellor’s Office for providing the data necessary for this analysis. The findings and conclusions here are those of the authors alone and do not necessarily reflect positions or policies of the agencies providing the data, the Wheelhouse board of advisors, or the funders, including the U.S. Department of Education. This infographic, like all PACE and Wheelhouse publications, has been thoroughly reviewed for factual accuracy and research integrity.


- 1Kurlaender, M., Reed, S., Grosz, M., Mathias, J., & Hughes, K. (2021, October). A foot in the door: Growth in participation and equity in dual enrollment in California [Research brief]. UC Davis Wheelhouse: The Center for Community College Leadership and Research. education.ucdavis.edu/sites/main/files/wheelhouse_research_brief_vol_6_no_7_final.pdf
- 2UC Davis Wheelhouse: The Center for Community College Leadership and Research. (2020, December). A rising tide: Dual enrollment is growing among California high school students [Infographic]. edpolicyinca.org/sites/default/files/2020-12/ig_wheelhousedec2020.pdf
Friedmann, E., Reed, S., Kurlaender, M., & Dykman, K. A. (February, 2024). A strong start for college and career: Dual enrollment participation from 9th to 12th grade [Infographic]. Policy Analysis for California Education. https://edpolicyinca.org/publications/strong-start-college-and-career