Unpacking California’s Chronic Absence Crisis Through 2022–23


Summary
Students are considered chronically absent when they miss 10 percent or more of school for any reason. Left unaddressed, chronic absence can translate into students having difficulty learning to read by Grade 3, reaching grade-level standards in middle school, and graduating from high school.1 Chronic absenteeism has soared in California and nationally in the wake of the COVID-19 pandemic, and addressing this extraordinary increase is crucial to helping students catch up academically.2 Using data available from the California Department of Education, this analysis examines trends in chronic absenteeism through school year 2022–23.3 Although rates of chronic absence have begun to decrease, they remain alarmingly high. Ensuring equitable opportunities to learn will require ongoing attention and action,4 including taking into account these seven key facts.
Rates of chronic absence in 2022–23, while down from the prior year, remain well above prepandemic levels
Chronic absence rates increased from 12 percent (702,531 students) in 2018–19 to a high of 30 percent (1,799,734) in 2021–22 (Figure 1). In 2022–23, there was a decrease of 5 percentage points to a chronic absenteeism rate of 25 percent (1,486,302 students). Although this modest decrease is a hopeful sign, rates are still much higher than they were prior to the pandemic. This indicates the need for continued and intentional investment in reengaging students and families and helping them to overcome barriers to getting to school.
Figure 1. Statewide Rates in Chronic Absence from 2017–18 to 2022–23
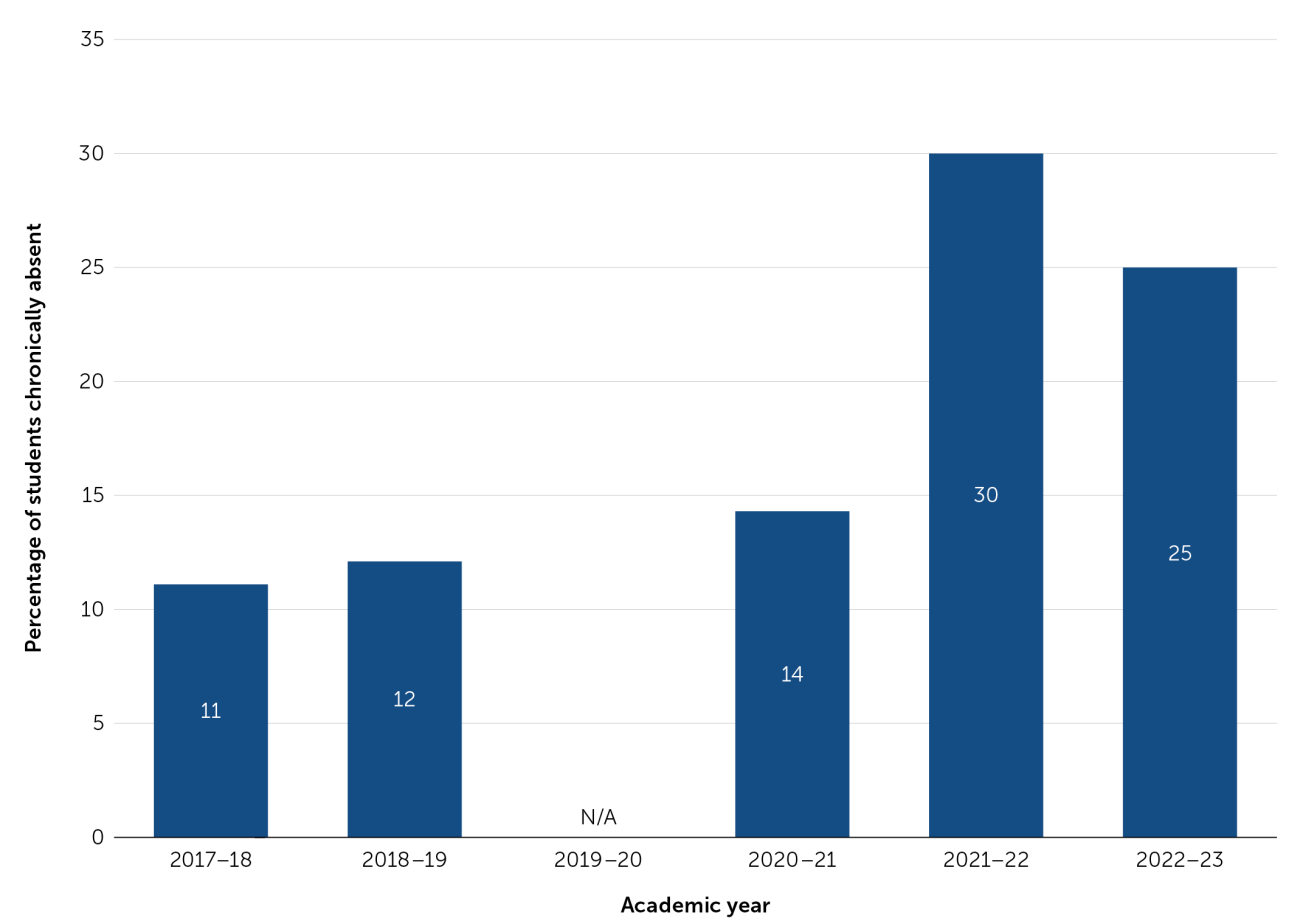
Note. The COVID-19 pandemic resulted in statewide physical school closures in February/March 2020 followed by the widespread implementation of distance learning during the 2020–21 academic year. The CDE has determined that absenteeism data are not valid and reliable for the 2019–20 academic year; therefore, the CDE has not processed these data and they are unavailable for public release.
The percentage of schools with high (20–29 percent of students) and extreme (30 percent or more of students) levels of chronic absence more than tripled during the pandemic
When at least 20 percent or more of students in a school are chronically absent, the educational experience of all students, not just the chronically absent students, is affected. The constant churn of students in classrooms negatively affects both teaching and learning.5
The data show that the percentage of schools with high (20–29 percent) and extreme (30 percent or more) levels of chronic absence rose from 21 percent in 2018–19 to 75 percent in 2021–22, with a modest decrease to 68 percent in 2022–23 (Figure 2). While this decrease is promising, the percentage of schools with high and extreme levels of chronic absenteeism remains three times higher than before the pandemic.
Figure 2. Percentage of Schools with Extreme and High Levels of Chronic Absence from 2017–18 to 2022–23
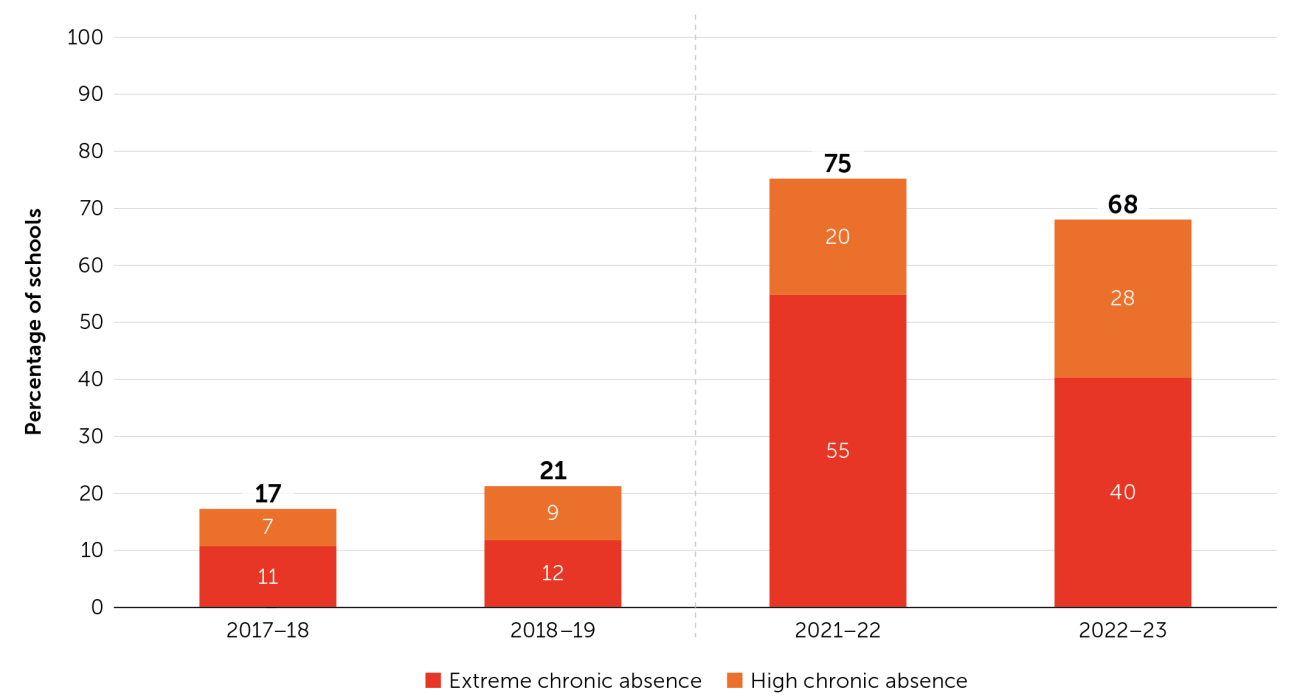
Note. Student attendance was not accurately captured in 2019–20 due to the onset of the pandemic in March 2020, or in 2020–21 due to distance learning; Figure 2 depicts years before and after the onset of the pandemic data from in-person school attendance. Extreme chronic absence is defined as 30 percent or more of students, and high chronic absence is defined as 20–29.9 percent of students.
Schools serving more socioeconomically disadvantaged (SED) students experience greater levels of chronic absenteeism
As shown in Figure 3, as the proportion of SED students6 in a school increases, so do the rates of chronic absenteeism. In the most affluent schools (those serving 0–24 percent SED students), only 2 percent have an extreme level of chronic absence, compared to 60 percent of the schools in which 75 percent or more of the students are socioeconomically disadvantaged.
SED students faced heightened challenges during the pandemic, and as a result these students are farther behind academically than their non-SED peers.7 The reasons for these students’ absences is complex, and therefore school and district actions to improve school attendance for students in this group must be multifaceted and include services that meet their basic needs, make school feel safe and welcoming, and ensure engaging and rigorous learning opportunities.8 Equally critical are partnerships with community organizations and public agencies for addressing barriers and challenges to school attendance that may fall beyond the capacity of educators alone to meet.
Figure 3. Schools with High and Extreme Chronic Absence Levels in 2022–23, by Proportion of Socioeconomically Disadvantaged Students
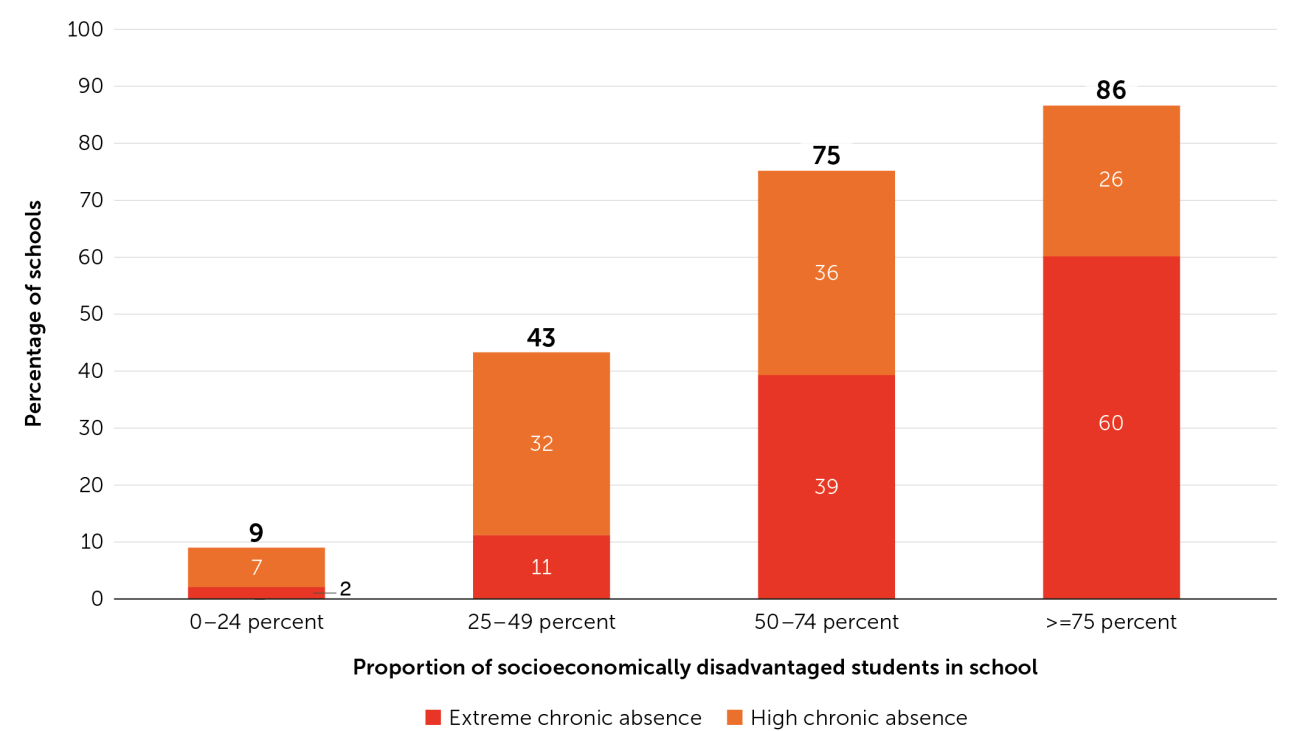
Note. Extreme chronic absence is defined as 30 percent or more of students, and high chronic absence is defined as 20–29.9 percent of students.
Since the onset of the pandemic, the number of elementary schools experiencing high and extreme levels of chronic absence has increased dramatically
Between 2019 and 2023, many more elementary, middle, and high schools experienced high to extreme chronic absence (Figure 4). The numbers increased the most for elementary schools (3,983 in 2023 versus 662 in 2019), which are both smaller and more numerous in the first place. Other schools, primarily alternative education schools, did not see as much change because they already struggled with extreme chronic absence even before the pandemic. The large number of elementary schools with high and extreme levels of chronic absence is concerning given the potential long-term and costly consequences if young students fall behind academically and do not develop a habit of regular attendance early in their school careers.
Figure 4. Schools with High and Extreme Chronic Absence Levels in California, by School Type and Year
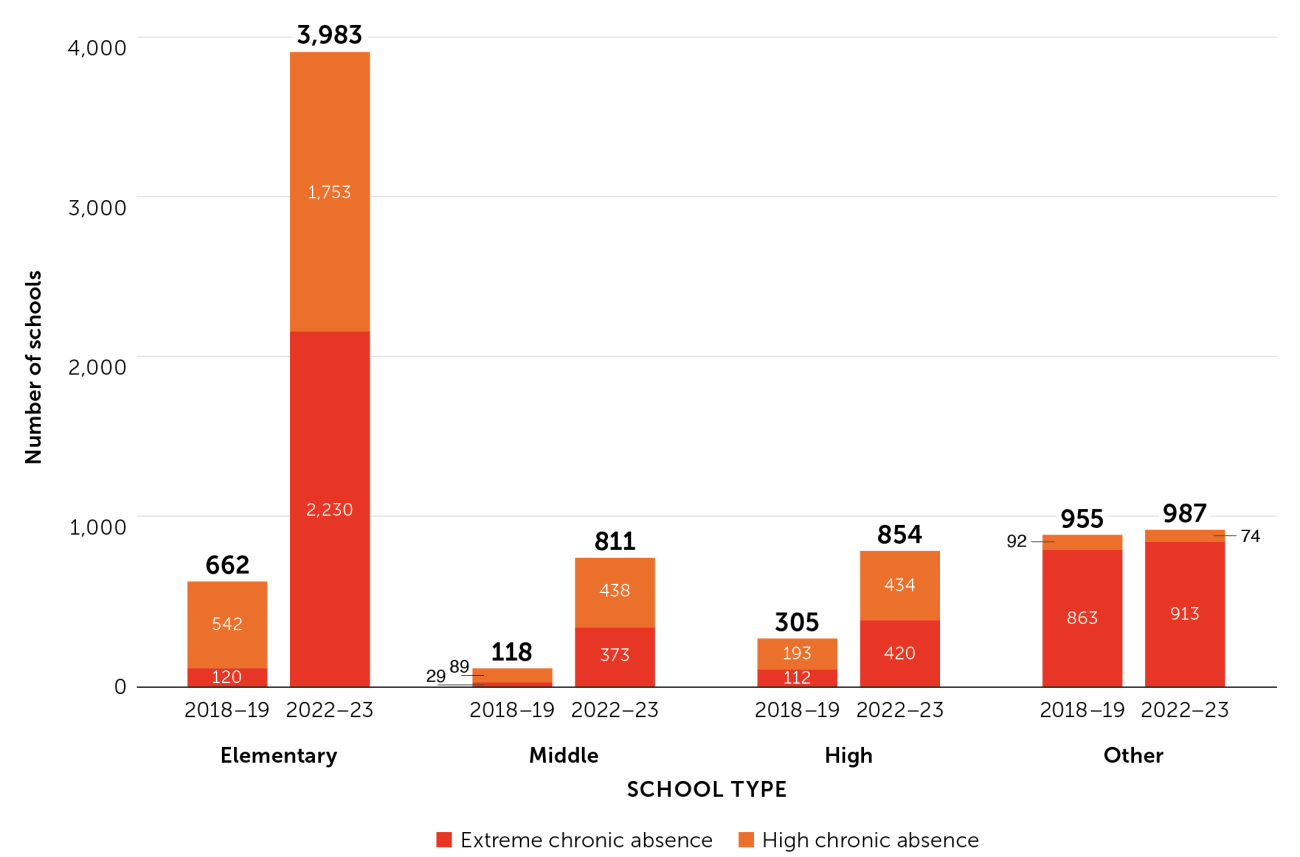
Note. Extreme chronic absence is defined as 30 percent or more of students, and high chronic absence is defined as 20–29.9 percent of students.
Especially high levels of chronic absence in kindergarten contribute to the large number of elementary schools facing extreme and high levels of chronic absence
Prior to the pandemic, kindergarten chronic absence was 16 percent, just slightly lower than the chronic absenteeism rate for high school. Kindergarten chronic absence increased to 40 percent in 2021–22 and remained at 36 percent in 2022–23, approximately 10 percentage points higher than high school rates (Figure 5). A key to stemming our attendance crisis is reducing kindergarten chronic absenteeism.9
Figure 5. Chronic Absenteeism by Grade and Year
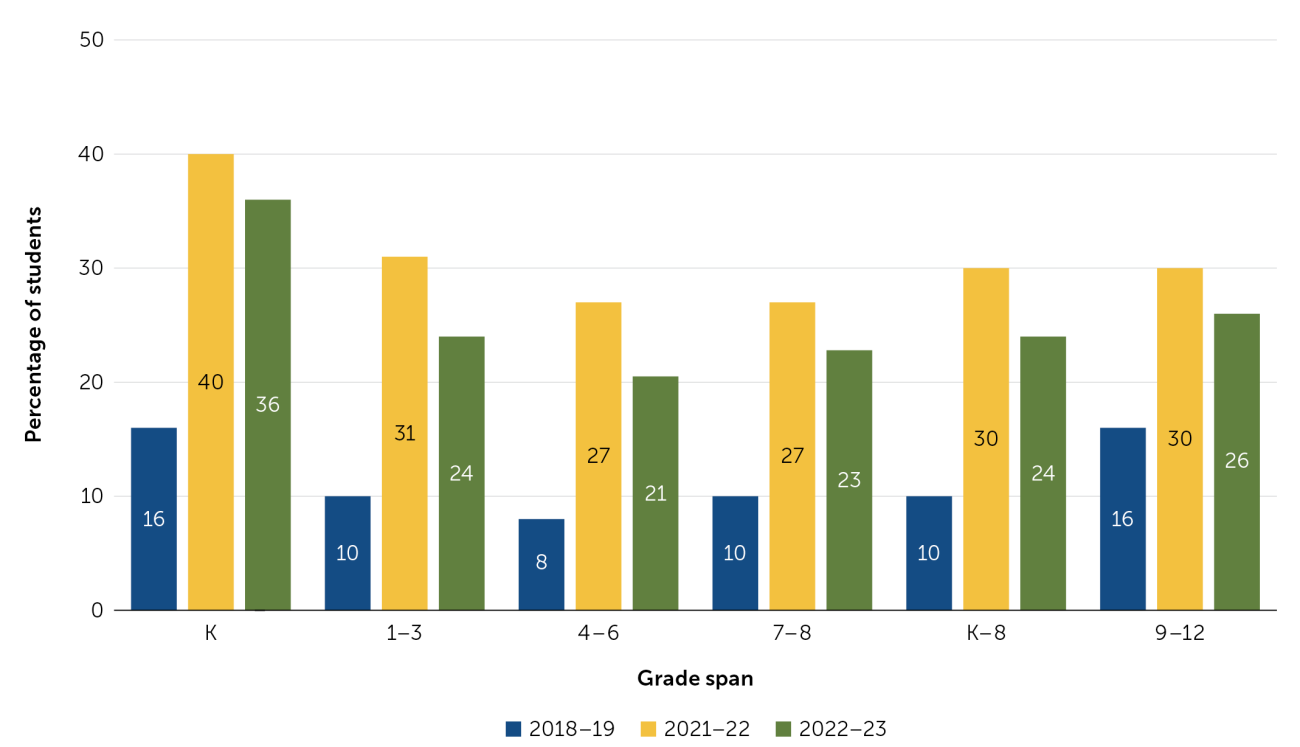
Note. Kindergarten attendance data includes Transitional Kindergarten (TK) program data.
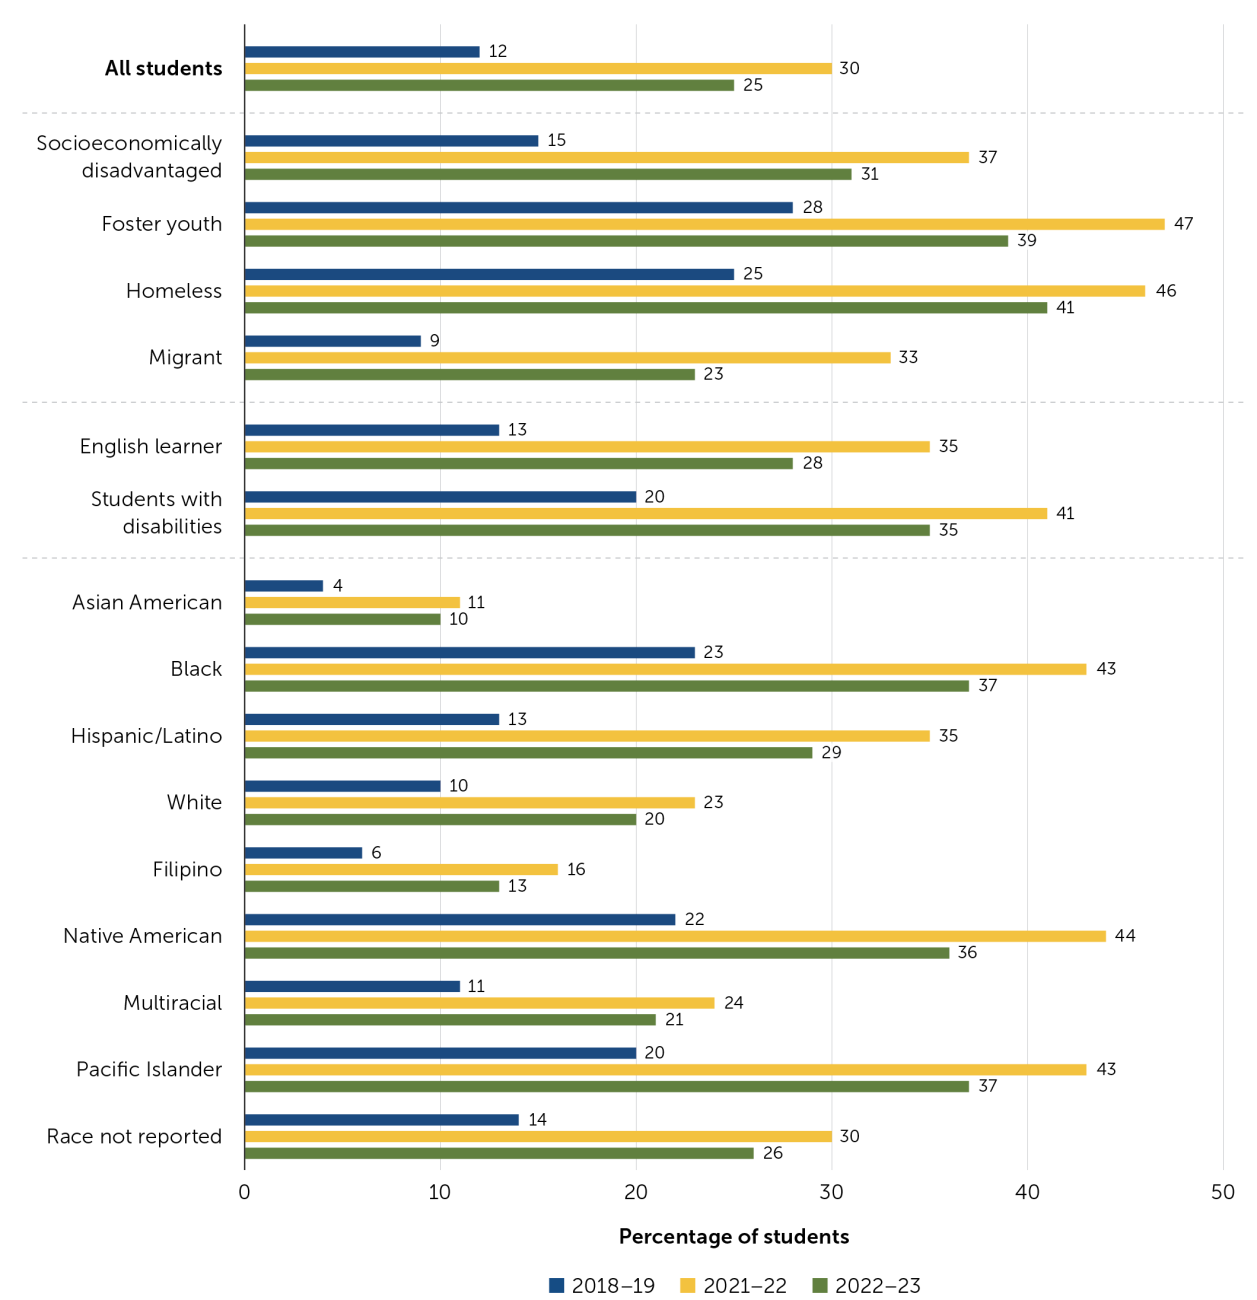
Chronic absence is especially high among particular student populations, although all have experienced modest decreases in the last year
Students who are involved in the foster care system, are experiencing homelessness, and/or have been identified as having a disability have extraordinarily high levels of chronic absenteeism (Figure 6). In addition, Native American, Black, and Pacific Islander students have especially high rates of chronic absence. For these populations, chronic absenteeism both reflects and exacerbates inequities. These high rates can reflect challenges facing students and families in the community (e.g., lack of access to health care, unreliable transportation, housing and food insecurity, etc.) and within the school (e.g., bullying, unwelcoming school climate, biased disciplinary or attendance practices, or lack of a meaningful and culturally relevant curriculum). Such difficulties can affect students’ ability to learn as well as cause them to fall farther behind because they miss invaluable instruction.
In addition to looking at who is most affected by chronic absence, it is also important to examine which racial/ethnic groups make up the largest number of chronically absent students. In California, Hispanic and Latino students are disproportionately represented among chronically absent students compared to other student populations; this group made up 65 percent (966,459) of the chronically absent students in 2022–23 and 56 percent of the student population overall. The next largest rates of chronic absence were among White (241,143) and Black students (110,537).
Figure 6. Chronic Absenteeism Rates by Student Group and Year
While chronic absence is a major challenge across the state, bright spots can be found in every type of locale in California
In every type of locale, the majority of schools has high and extreme levels of chronic absence, but there is a small percentage of schools with much better attendance in each locale type as well (Figure 7). These data show that all types of communities can and should care about reducing rates of chronic absence. Fortunately, data can be used to identify potential bright spots that can yield important insights about what works given their local conditions.
Figure 7. School-Level Chronic Absence by Locale Type, 2022–23
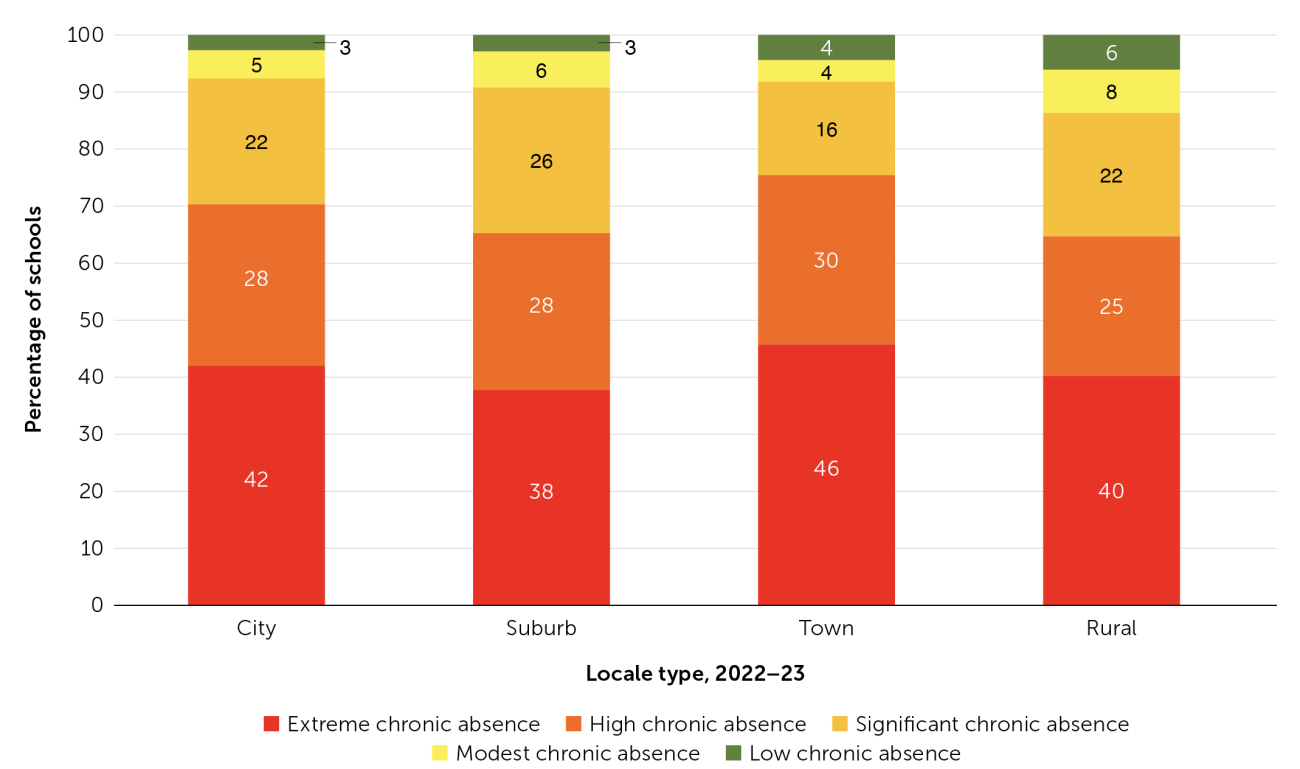
Note. Extreme chronic absence is defined as 30 percent or more of students; high chronic absence as 20–29.9 percent; significant chronic absence as 10–19.9 percent; modest chronic absence as 5–9.9 percent; and low chronic absence as 0–4.9 percent. Locale data was obtained from the National Center for Education Statistics (NCES).
Conclusion
The alarmingly high levels of chronic absenteeism occurring nationwide require sustained attention and action. Although the California numbers are challenging, absenteeism can be addressed when districts, with state support, help schools take a comprehensive, data-informed approach to attendance that is grounded in an understanding of local assets and difficulties faced by students and families. This analysis of 2022–23 school-year data offers hopeful signs that attendance levels in California are moving in the right direction,10 but even greater efforts are needed in the schools and communities most affected by COVID-19 and education inequities.
- 1Balfanz, R., & Byrnes, V. (2012, May). The importance of being in school: A report on absenteeism in the nation’s public schools [Report]. Johns Hopkins University Center for Social Organization of Schools. new.every1graduates.org/wp-content/uploads/2012/05/FINALChronicAbsenteeismReport_May16.pdf; Chang, H., & Romero, M. (2008, September). Present, engaged, and accounted for: The critical importance of addressing chronic absence in the early grades [Report]. National Center for Children in Poverty. nccp.org/wp-content/uploads/2008/09/text_837.pdf; Ehrlich, S. B., et al. (2014, May). Preschool attendance in Chicago public schools: Relationships with learning outcomes and reasons for absences [Research report]. University of Chicago Consortium on Chicago School Research. files.eric.ed.gov/fulltext/ED553158.pdf; Utah Education Policy Center. (2012, July). Research brief: Chronic absenteeism. University of Utah. daqy2hvnfszx3.cloudfront.net/wp-content/uploads/sites/2/2017/05/23104652/ChronicAbsenteeismResearchBrief.pdf
- 2Hough, H. J., & Chavez, B. (2024, January). California test scores show little improvement after pandemic [Policy brief]. Policy Analysis for California Education. edpolicyinca.org/publications/california-test-scores-show-little-improvement-after-pandemic
- 3This analysis includes all publicly available absence data as documented by the California Department of Education. In the academic year 2022–23, there were a total of 9,984 public schools, with 859 categorized as Dashboard Alternative Status Schools (DASS) schools and 1,283 as charter schools.
- 4Jordan, P. W. (2023, May 8). Attendance playbook: Smart solutions for reducing student absenteeism post-pandemic [Report]. FutureEd. future-ed.org/attendance-playbook
- 5Gottfried, M. A. (2019). Chronic absenteeism in the classroom context: Effects on achievement. Urban Education, 54(1), 3–34. doi.org/10.1177/0042085915618709
- 6In California, students are considered socioeconomically disadvantaged if they meet any one of the following criteria during the reporting period: (a) neither of the student’s parents has received a high school diploma; (b) the student is eligible for or participating in the Free or Reduced-Price Meal program; (c) the student is eligible for or participating in the Title I, Part C Migrant Education Program; (d) the student was considered homeless; (e) the student was foster-program eligible; (f) the student was directly certified; (g) the student was enrolled in a Juvenile Court School; or (h) the student is eligible as tribal foster youth.
- 7Hough & Chavez, 2024.
- 8Attendance Works. (2023, November 17). All hands on deck: Today’s chronic absenteeism requires a comprehensive district response and strategy [Blog article]. attendanceworks.org/todays-chronic-absenteeism-requires-a-comprehensive-district-response-and-strategy; Myung, J., & Hough, H. J. (2023, November). Why aren’t students showing up for school? Understanding the complexity behind rising rates of chronic absenteeism [Commentary]. Policy Analysis for California Education. edpolicyinca.org/newsroom/why-arent-students-showing-school
- 9It is important to note, however, that high school rates of chronic absence are likely an underestimate. Because most districts in California are funded based on average daily attendance, students are typically counted as present as long as they show up for a single period. By contrast, at least 17 other states require students to be present for at least half a day to be counted as present. See Attendance Works. (2022, June). Monitoring who is missing too much school: A review of state policy and practice in school year 2021–22 [Brief]. attendanceworks.org/monitoring-who-is-missing-too-much-school-a-review-of-state-policy-and-practice-in-school-year-2021-22
- 10This analysis also shows the value of states using their own data to assess whether chronic absence rates are improving based on the most recent data available. To learn more about the national context and actions that states can take, read “Turning Back the Tide: The Critical Role of States in Reducing Chronic Absenteeism.”