Why California Should Retire the Free or Reduced-Price Meal Measure—and What the State Should Do Next


In 2013–14, California enacted an ambitious—and essential—reform to improve educational equity by directing state resources to districts and schools that educate large numbers of economically disadvantaged students. The reform is called the Local Control Funding Formula (LCFF); it allocates funding to school districts based on student characteristics such as socioeconomic status and provides greater flexibility to use the allocated funds than the previous school funding formula allowed. In addition to the LCFF, which is based on average daily attendance (ADA), districts receive funds based on the proportion of students they serve who are English learners, income eligible for free or reduced-price meals, and foster youth.1 The equity multiplier, a new policy passed in 2023, is designed to provide even more funding for disadvantaged students.
The success of these efforts hinges on a valid measurement of student disadvantage. If the state does not know where disadvantaged students are, it cannot effectively target support to them. It is unfortunate, therefore, that as a proxy for economic disadvantage, California state policy continues to lean heavily on eligibility for free or reduced-price meals (FRPL, for the former name of free and reduced-price lunch).2 This measure has long been a workhorse for educational research and policy, but it is time to retire it. Here are three reasons why:
1. FRPL Is a Noisy Measure of Students’ Economic Disadvantage
Traditionally, to apply for FRPL, students fill out a form reporting total family income from all sources. Students who report that total family income is less than 1.85 times the federal poverty line qualify for reduced-price lunch; students who report that total family income is less than 1.3 times the federal poverty line qualify for free lunch. Thus, even in the best of circumstances, FRPL data cannot capture the range of differences in students’ family income beyond these two categories.
Unique data linkage in Oregon allows us to compare FRPL status with tax filing information. We found considerable variation in FRPL enrollment even among students whose families report, in their annual Internal Revenue Service (IRS) tax filings, the same level of household income. Many students whose tax filings indicate that they are income eligible for FRPL are not enrolled in the program, while many students who appear to be ineligible are enrolled.
The mismatch between income eligibility and program enrollment may be because students whose families are income eligible choose not to complete the form for FRPL enrollment. In other cases, the students’ family income may change over the course of the school year, so that FRPL status no longer reflects a true picture. Whatever the source of the mismatch, the findings demonstrate that FRPL does not perfectly capture student economic disadvantage. Although our analysis utilizes a data linkage that is only available in Oregon, we believe the data have important implications for education policy in California.
2. FRPL’s Shortcomings As a Measure of Economic Disadvantage Are Becoming More Pronounced Over Time
The Community Eligibility Program (CEP), implemented nationally in 2015, allows schools that serve high proportions of economically disadvantaged students to offer free lunch to all students, regardless of whether they are income qualified. Last year, California built on this program, becoming the first U.S. state to provide free meals to all students in all schools. We support these policies enthusiastically. Universal free meals both improve youth nutrition and reduce the stigma associated with free meals, thus creating the potential to substantially improve the lives of young people.
But when school meals are available to all regardless of household income, families have less incentive to complete FRPL enrollment forms, further eroding the usefulness of FRPL as a measure of economic disadvantage. Figure 1, which we reproduce from a paper in the journal Educational Evaluation and Policy Analysis (see also open access working paper), illustrates this.
Figure 1. Three Measures of Student Economic Disadvantage in Oregon, 2010–17
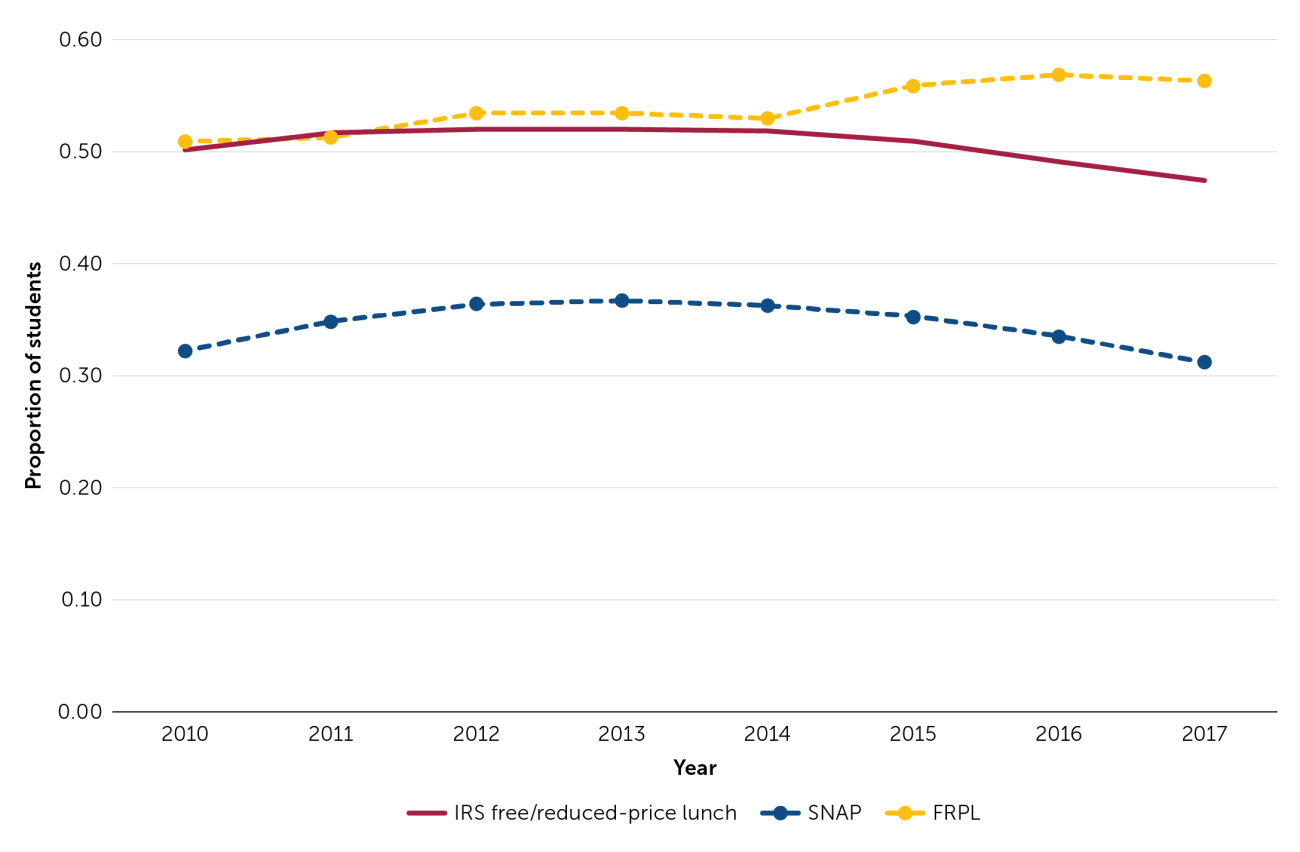
This figure displays trends between 2010 and 2017 for three measures of economic disadvantage:
- The solid red line represents the proportion of all students in Oregon public schools who have a demonstrated household income of less than 1.85 times the federal poverty line either via annual IRS tax filings or via their enrollment in the federal means-tested Supplemental Nutrition Assistance Program (SNAP).
- The yellow dashed line represents the proportion of students enrolled in FRPL.
- The blue dashed line represents the proportion of students enrolled only in SNAP.
The figure demonstrates that when Oregon implemented CEP in 2015, the FRPL rate diverged from the IRS-tax-derived FRPL measure. While the proportion of students in the state who were economically disadvantaged—as defined by the IRS FRPL measure—declined post-2015, the FRPL rate rose. By 2017, the FRPL measure showed that 56 percent of students were economically disadvantaged while the IRS-derived measure showed that 47 percent were economically disadvantaged.
FRPL rates jumped in Oregon after CEP implementation because many schools who used the policy to offer universal free meals reported that 100 percent of their students qualified for free or reduced-price lunch. While accurate from a program participation perspective, the change is troubling from a measurement perspective because it obscures meaningful differences among the state’s most economically disadvantaged schools.
This phenomenon is likely more acute in California, where all students in all schools are now eligible for free meals. So why does California’s Education Code continue to use FRPL when targeting supplemental funds at schools and districts that educate economically disadvantaged students?
3. California Can Do Better
Our research shows that the third measure represented in Figure 1—the proportion of students enrolled in SNAP—can provide a sound alternative to FRPL. In Figure 1, this third measure—which is sometimes referred to as the Identified Student Percentage (ISP)—unlike FRPL over time follows trends in how many students in the state are actually economically disadvantaged. Further analyses indicate that this measure, rather than the FRPL enrollment rate, far more effectively discerns between schools with moderately high levels of student poverty and schools with extreme levels of student poverty.
The California Department of Education (CDE) appears to recognize FRPL’s measurement issues. In 2017, the CDE began to report ISP data, rather than FRPL data, as the primary school-level measure of economic disadvantage. These data were to be shared publicly via the U.S. Department of Education’s Common Core of Data. The state’s education code should follow suit so that the supplementary resources intended to benefit economically disadvantaged students under the LCFF reach their targets.
While the ISP is a higher quality measure of student economic disadvantage than FRPL, it is not perfect. ISP still depends on participation in means-tested programs, which have lower participation rates among immigrant families. However, given available measures, our work shows that ISP is a far more reliable measure of economic disadvantage than FRPL.
Spiegel, M., Domina, T., & Penner, A. (2023, December). Why California should retire FRPL measure—and what the state should do next [Commentary]. Policy Analysis for California Education. https://edpolicyinca.org/newsroom/why-california-should-retire-frpl-and-what-state-should-do-next
- 1Districts receive supplemental grants equal to 20 percent of the adjusted base grants multiplied by the unduplicated percentage of English learners, students income eligible for free or reduced-price meals, and foster youth pupils as well as concentration grants equal to 65 percent of the adjusted base grants multiplied by the percentage of unduplicated pupils above 55 percent.
- 2California’s definition for socioeconomic disadvantage includes the following: neither of the student’s parents has received a high school diploma; the student is eligible for or participating in the free meal program or reduced-price meal program; the student is eligible for or participating in the Title I, Part C Migrant Education program; the student is considered homeless; the student is foster program eligible; the student is directly certified; the student is enrolled in a juvenile court school; the student is tribal foster youth eligible. To target funds, the state also measures student turnover by calculating the percentage of students who do not complete more than approximately two thirds of the school year.