California Test Scores Show the Devastating Impact of the Pandemic on Student Learning


For more recent data, see the 2024 PACE policy brief "California Test Scores Show Little Improvement After Pandemic."
Last week, the California Department of Education released test scores of all students in Grades 3–8 and 11 for the first time since before the COVID-19 pandemic. This year’s results represent the first opportunity to understand fully how California students’ learning has been affected by the pandemic and related school closures. The test results show a substantial decline in student learning in both English language arts/literacy (ELA) and mathematics between the 2018–19 and 2021–22 academic years.
Analytic Notes
Both the COVID-19 pandemic and economic conditions in California have contributed to significant changes in enrollment in schools across the state. Enrollment dropped by a record 2.6 percent in 2020–21 and an additional almost 2 percent in 2021–22, resulting in a loss of 270,000 students statewide.1 Because of the way student test results are reported, these population changes can present some issues when comparing student performance across time. Rather than tracking the performance of an individual student, the state tests compare the performance of cohorts over time. This means that if the cohort composition changes from one year to the next, it can make comparisons difficult.
Overall, the number of students tested decreased by approximately 6 percent from 2019 to 2022 and varied by grade level. Some grades had larger decreases in the number of students tested; for example, there was a decline of 11.5 percent for seventh grade. Others saw a lower decrease; for example, the number of 11th-grade students tested decreased the least at approximately 3 percent. A 6-percent decline in the tested population is completely unprecedented and could mean that we are comparing the test scores of very different populations from before the pandemic and now. Future research must investigate student-level growth, as that provides a more accurate analysis of how learning has changed over time.2
Although these results are not surprising, they are troubling and represent new, important, and actionable information. Since the pandemic physically closed schools in March 2020, researchers have predicted and then estimated the impact of extended educational disruptions on student learning3 and have consistently shown that student learning is behind where it would have been in the absence of the pandemic.
Researchers have raised concerns about the differential impact on low-income students, students of color, and students learning English for a few reasons. First, students in these groups were more likely to have suffered economically during the pandemic and to experience illness or even death in their families.4 Second, distance learning was very challenging for students if they didn’t have access to technology or a parent at home to help, or if their parents don’t have a formal education themselves or don’t speak English.5 Finally, these students’ test scores were already lower than students in other groups, largely because of existing structural inequities that were then exacerbated by the pandemic.
Until this point, however, the data that researchers have been able to analyze have come from either a subset of districts or outside California. With data for all California students in Grades 3–8 and 11 now available, we can analyze patterns in declines in student learning to attend to equity and inform service delivery. The Smarter Balanced Summative Assessments are comprehensive, end-of-year assessments aligned with the Common Core State Standards for ELA and math that measure progress towards college and career readiness. Because these tests are computer adaptive, they provide precise measurements across the full range of achievement6 and can be used to understand the impact of the pandemic on students more fully. We share four concerning findings from last week’s release.
ELA performance is down in all grades but is worst in third grade, highlighting significant concerns for early literacy development
Figure 1. Percentage of students meeting or exceeding standards in ELA in 2018–19 versus 2021–22, by grade
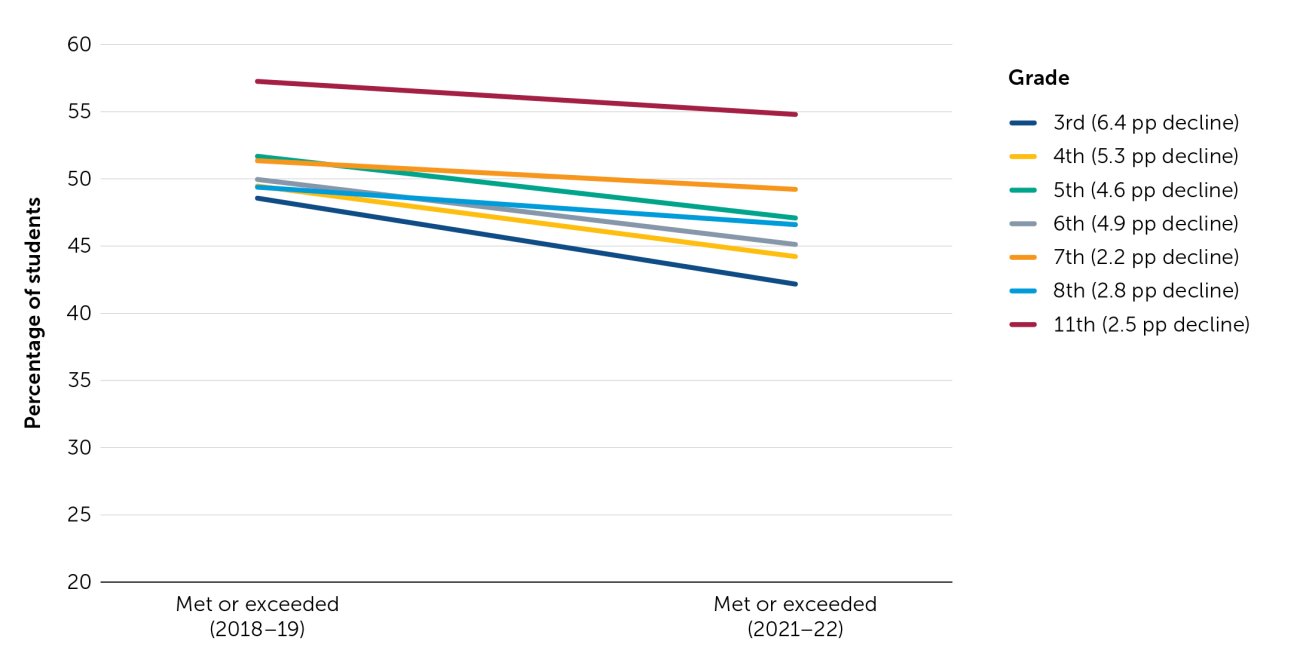
Note. pp = percentage point
As shown in Figure 1, the percentage of students meeting or exceeding ELA standards has declined for every grade, but the worst decline is in third grade. For third graders in 2021–22, the proportion of students meeting or exceeding standards declined by 6.4 percentage points (pps), compared with a decline of 2–5 pps for the other tested grades. To contextualize these results, students in third grade in 2021–22 were in first grade when the pandemic hit, so it is likely that students in this cohort learned remotely for most to all of their second-grade year and continued to experience pandemic-related disruptions during their third-grade year.
This impact on ELA development in the primary grades is concerning given the importance of literacy for academic development. A large body of prior research has identified literacy by the third grade as a critical gateway for students’ future academic and life success.7 If students are unable to regain this loss, they may experience delays in other reading-related skill building, making it difficult to access future academic content and learning.
These results may portend additional literacy impacts on students in younger grades, whose critical preschool and kindergarten years were disrupted by school closures and distance learning. For example, students in third grade this academic year were in kindergarten when the pandemic began, and they will be tested for the first time in spring 2023.
Math achievement is down dramatically in all grade levels but is worst in eighth grade
Figure 2. Percentage of students meeting or exceeding standards in math in 2018–19 versus 2021–22, by grade
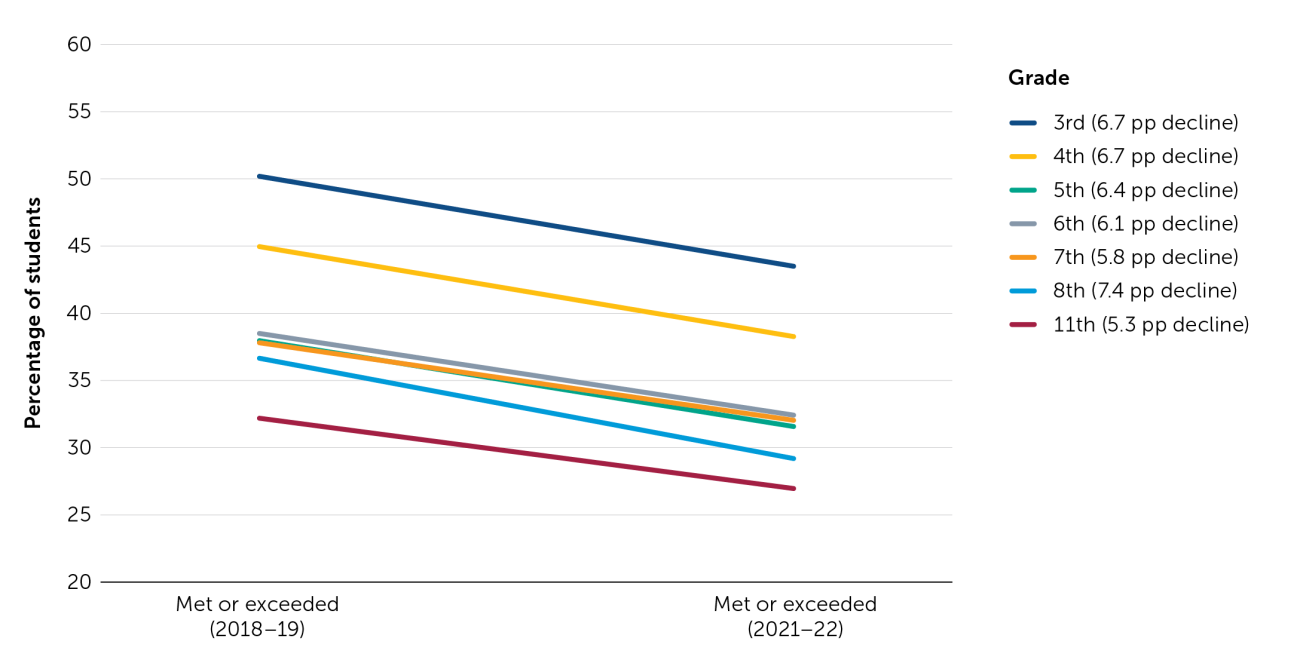
Note. pp = percentage point
As shown in Figure 2, the proportion of students meeting or exceeding standards in math declined dramatically in 2021–22 from 2018–19, but eighth-grade students were affected the most. This cohort of students was in fifth grade when the pandemic started, and their performance overall is 7.4 pps lower than the previously tested cohort. This is important because if students have gaps in their basic understanding of mathematics in eighth grade, it will be challenging for them to succeed in higher level math courses in high school, which can limit their access to competitive universities and STEM-focused careers.8
Low-income students, Black students and other students of color, and English learners have been severely affected
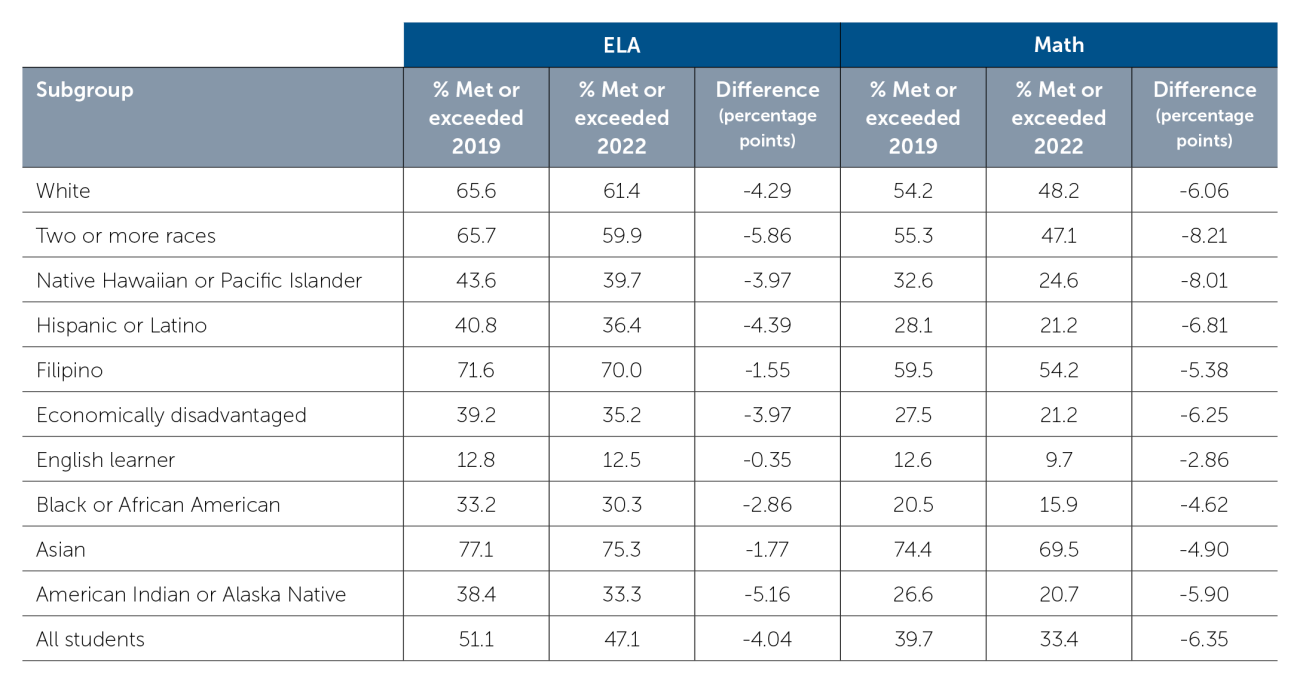
When looking at the impacts of the pandemic and related school disruptions on student achievement, it is critical to investigate how students in different groups have been affected. As shown in Figures 3 and 4, Native Hawaiian/Pacific Islander, Hispanic/Latino, economically disadvantaged, English learner, Black/African American, and American Indian/Alaska Native students were already performing at much lower levels than Asian, White, Filipino, and students with more than two races, and they experienced substantial declines from 2019 (blue dot markers) to 2022 (red circle markers). The arrow sizes show how much the decrease was for each subgroup between those two testing years; these values are included in Table 1.
Figure 3. Percentage-point change in proportion of students meeting or exceeding math standards from 2018–19 to 2021–22, by student group
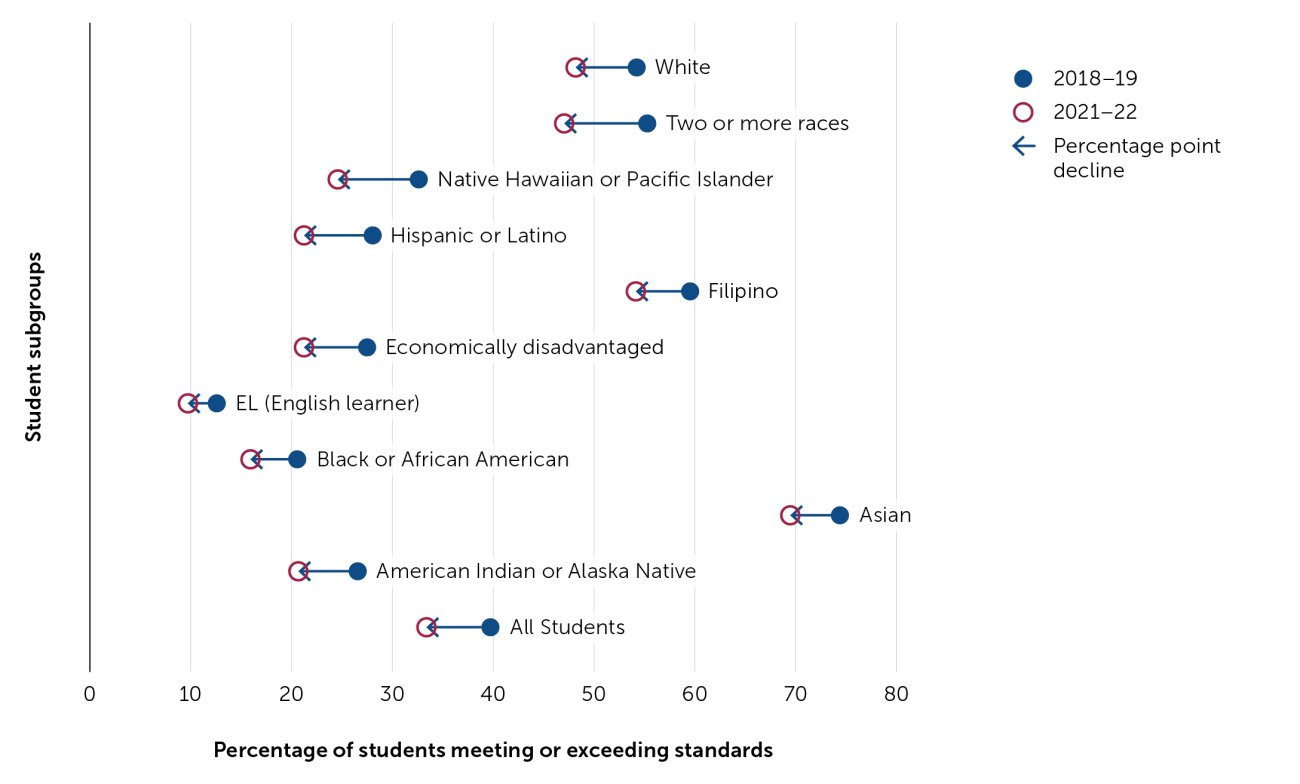
Figure 4. Percentage-point change in proportion of students meeting or exceeding ELA standards from 2018–19 to 2021–22, by student group
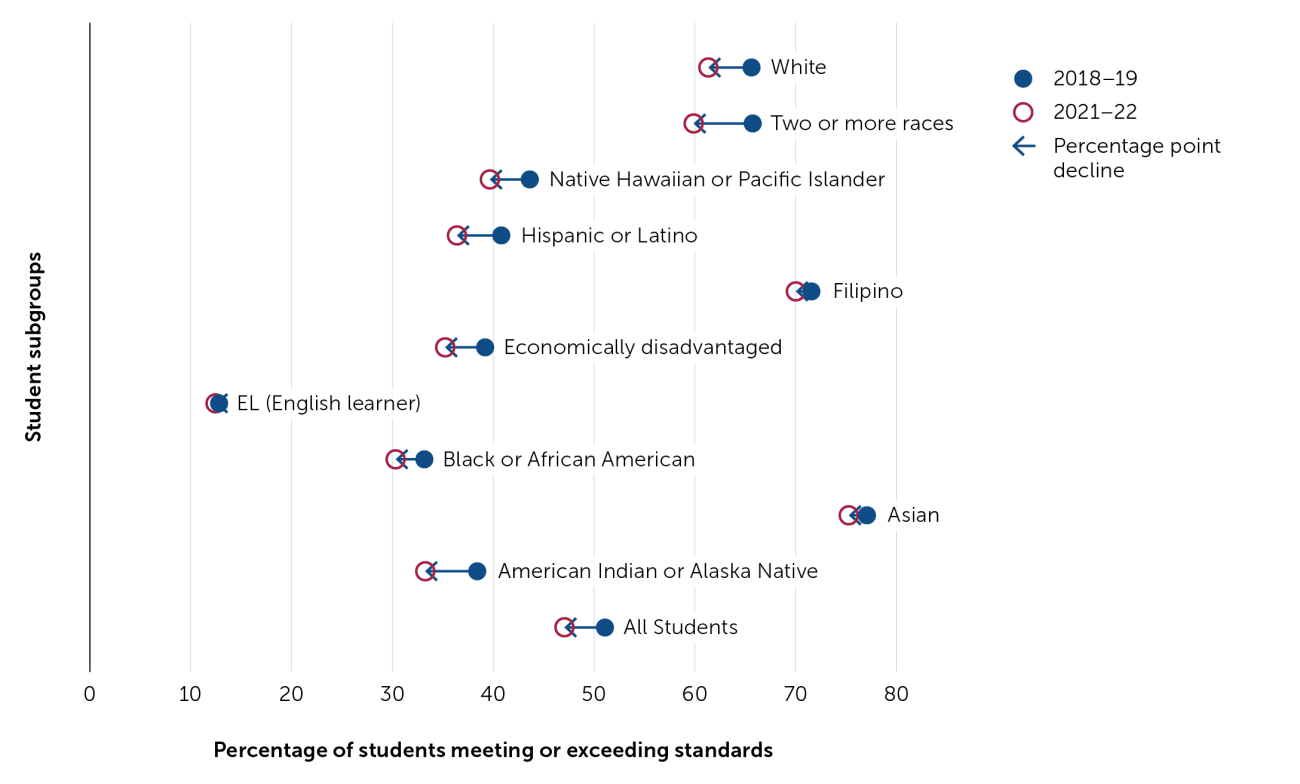
Table 1. Percentages of students meeting or exceeding ELA (columns 1–3) and math (columns 4–6) standards and differences between 2018–19 and 2021–22, by student group
There are substantial differences by district that must be investigated further
In thinking about these results, state-level analysis goes only so far. We must analyze district- and school-level results to better understand variation across the state. Some districts and schools have done well at preventing declines from 2019 to 2022. Further research must aim to identify what they have done and spread those practices elsewhere. Similarly, it is critical to identify districts where students are doing poorly comparatively. State leaders must then use this information to direct more support to those districts to help them better serve students and identify their challenges that need to be addressed.
To shed light on this issue, we looked at how student performance has changed between 2018–19 and 2021–22 for districts with varying levels of student poverty. This is important to investigate because the academic achievement of economically disadvantaged students has been among the most affected by the pandemic. For example, less than one quarter (21 percent) of economically disadvantaged students met or exceeded the state’s standard in mathematics in 2021–22, showing a substantial decline (6.25 pps) from prepandemic measures.
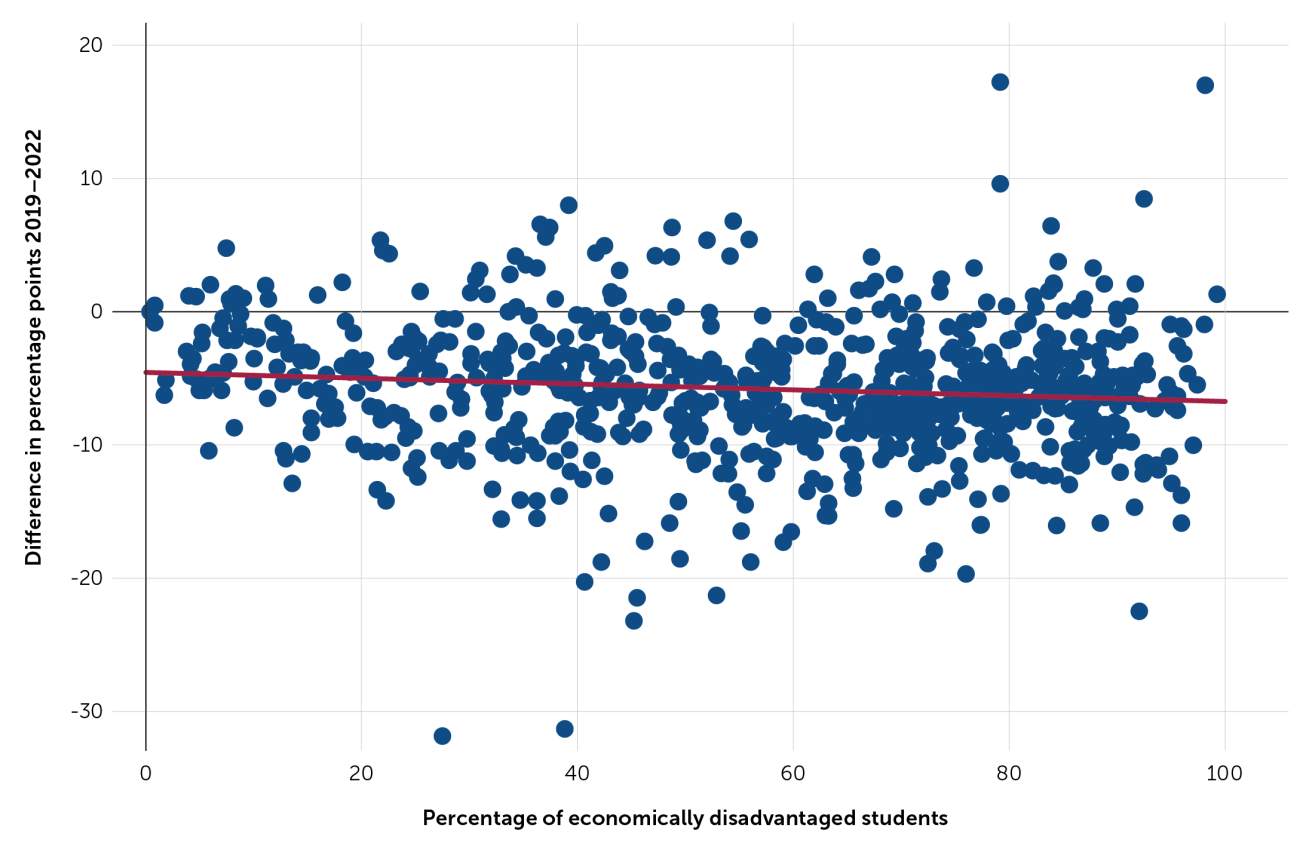
Figures 5 and 6 show that districts with higher percentages of economically disadvantaged students generally experienced larger declines in test scores.9 However, this was not true in all districts serving high percentages of economically disadvantaged students. In the top right quadrant are districts with high proportions of economically disadvantaged students that saw an increase in test scores from before the pandemic to the present. There is much to learn from these districts about what works and under what conditions. The lower right quadrant shows districts that have high proportions of economically disadvantaged students and had a significant decrease in test scores from before the pandemic to the present. These are districts that need intensive support and resources to accelerate student learning.
Figure 5. Relationship between change in ELA scores and proportion of economically disadvantaged students in a district
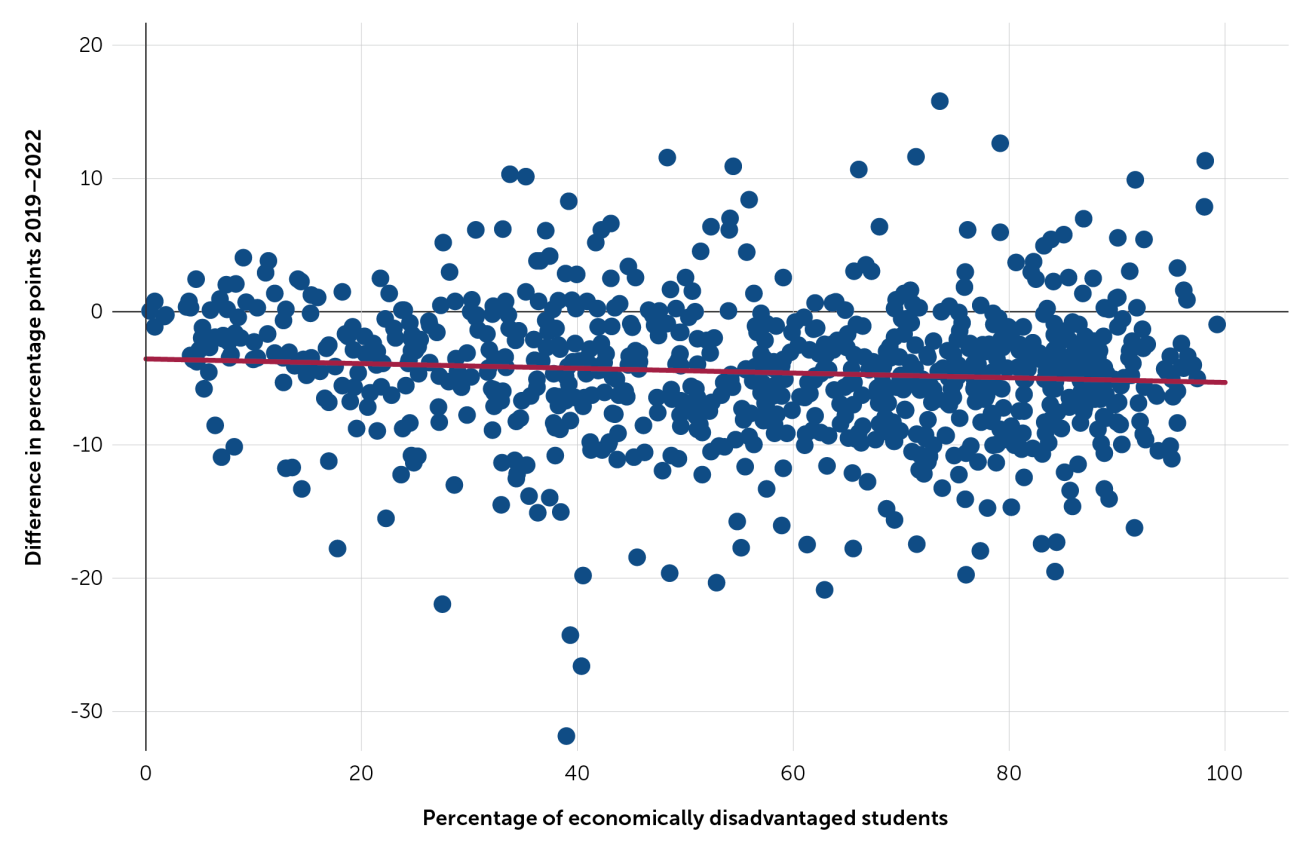
Figure 6. Relationship between change in math scores and proportion of economically disadvantaged students in a district
Where Do We Go From Here?
Even before the COVID-19 pandemic, we and many others in the education research community were concerned that California’s public schools weren’t serving all students well. The state’s education system was highly inequitable and plagued by gaps in opportunity and access that the pandemic has only widened. Last spring, a coalition of more than 40 California-based organizations representing families and students, educators and system leaders, research institutes, and civil rights and equity organizations called for education and policy leaders to reimagine and rebuild California’s schools.10 But little progress has been made during the pandemic, with challenges driven by COVID-19 continuing to vex educators and policymakers, making real progress seem almost impossible. These test scores should sound a loudly screaming alarm: The task of transforming our schools can no longer be delayed.
Note: In the original posting of this commentary, figures 3 and 4 were switched. They have been corrected in this version (11 October 2023).
Hough, H. J., & Chavez, B. (2022, October). California test scores show the devastating impact of the pandemic on student learning [Commentary]. Policy Analysis for California Education. https://edpolicyinca.org/newsroom/california-test-scores-show-devastating-impact-pandemic-student-learning
- 1Fensterwald, J., & Willis, D. J. (2022, April 11). California K–12 enrollment plunges again, falls below 6 million. EdSource. edsource.org/2022/california-k-12-enrollment-plunges-again-falls-below-6-million/670111
- 2Polikoff, M. (2019, September). On growth models, time for California to show some improvement [Policy brief]. Policy Analysis for California Education. edpolicyinca.org/publications/growth-models-time-california-show-improvement
- 3Hough, H. J., Myung, J. Domingue, B. W., Edley, C., Jr., Kurlaender, M., Marsh, J. A., & Rios-Aguilar, C. (2021, September). The impact of the COVID-19 pandemic on students and educational systems: Critical actions for recovery, and the role of research in the years ahead [Article]. Policy Analysis for California Education. edpolicyinca.org/publications/impact-covid-19-pandemic-students-and-educational-systems
- 4Tai, D. B. G., Shah, A., Doubeni, C. A., Sia, I. G., & Wieland, M. L. (2021, February). The disproportionate impact of COVID-19 on racial and ethnic minorities in the United States. Clinical Infectious Diseases, 72(4), 703–706. doi.org/10.1093/cid/ciaa815; Fortuna, L. R., Tolou-Shams, M., Robles-Ramamurthy, B., & Porche, M. V. (2020). Inequity and the disproportionate impact of COVID-19 on communities of color in the United States: The need for a trauma-informed social justice response. Psychological Trauma: Theory, Research, Practice, and Policy, 12(5), 443–445. doi.org/10.1037/tra0000889
- 5Aguilar, S. J., Galperin, H., Baek, C., & Gozalez, E. (2020, October 14). When school comes home: How low-income families are adapting to distance learning. EdArXiv. doi.org/10.35542/osf.io/su8wk; Polikoff, M., Saavedra, A. R., & Korn, S. (2020, May 8). Not all kids have computers—and they’re being left behind with schools closed by the coronavirus. The Conversation. theconversation.com/not-all-kids-have-computers-and-theyre-being-left-behind-with-schools-closed-by-the-coronavirus-137359
- 6California Department of Education. (n.d.). Smarter Balanced Summative Assessments. www.cde.ca.gov/ta/tg/sa/sbacsummative.asp
- 7Annie E. Casey Foundation. (2010). Early warning! Why reading by the end of third grade matters [Report]. www.aecf.org/resources/early-warning-why-reading-by-the-end-of-third-grade-matters
- 8Asim, M., Kurlaender, M., & Reed, S. (2019, August). 12th grade course-taking and the distribution of opportunity for college readiness in mathematics [Report]. Policy Analysis for California Education. edpolicyinca.org/publications/12th-grade-course-taking-and-distribution-opportunity-college-readiness-mathematics
- 9The x-axis represents the percentage of enrolled students who are economically disadvantaged (eligible for free or reduced-price lunch or programs for migrant youth, youth in foster care, or students experiencing homelessness). The y-axis represents the difference in pps for students meeting or exceeding state standards between test years 2019 and 2022. The trendline (gray) shows the negative correlation between these two variables.
- 10Reimagine and Rebuild California Schools Project. (2021). Reimagine and rebuild California schools: Restarting school with equity at the center. reimaginecaschools.org