California Test Scores Show Little Improvement After Pandemic


Summary
For more recent data, see the 2025 PACE commentary "Modest Gains and Persistent Gaps in Student Performance in 2023–24."
In October 2023, the California Department of Education released test scores for all students in Grades 3–8 and 11 for the 2022–23 school year. These results represent an opportunity to analyze whether and to what extent student learning has rebounded after the dramatic declines in scores resulting from the COVID-19 pandemic and related school closures. Despite marginal improvements from 2021–22, student cohorts in 2022–23 remain very far behind prepandemic levels: in ELA, by 4.4 percentage points, and in math, by 5.1 percentage points. Most concerning is that these scores reveal so starkly the large and growing opportunity gaps between student groups.
Introduction
It is now widely understood that student learning was seriously affected by the COVID-19 pandemic. Since the pandemic physically closed schools in March 2020, researchers have predicted and then estimated the impact of the extended disruptions in education on student learning;1 the research has consistently shown that student learning is behind where it would have been in the absence of the pandemic and that the impact has been most detrimental for low-income students, students with disabilities, students of color, and students learning English. These groups faced heightened challenges during the pandemic, experiencing greater economic hardship, family illness, and loss of life in their families and communities2 and encountering formidable obstacles in the transition to distance learning.3
Understanding the threats that these learning lags pose to students’ learning progressions and long-term opportunities, state4 and federal5 leaders made unprecedented investments to help educators respond to students’ needs and accelerate learning. From the public discourse, it appears there had been hope that, given the substantial investments, students’ test scores might rebound as dramatically as they declined. However, the 2021–22 and 2022–23 academic years witnessed substantial challenges, including staffing shortages,6 chronic absenteeism,7 worsening mental health in youth,8 local political complexities,9 and educator strikes,10 all of which made it difficult to provide the instruction and services needed. It is imperative now to take stock of our situation and contemplate the necessary interventions, policies, and investments needed as we move forward.
Standardized tests offer a specific lens through which student learning can be assessed, providing quantitative data on academic performance, but they are limited in their ability to capture the holistic nature of education. These assessments do not illuminate whether students are motivated to learn, if their coursework aligns with their aspirations, or if they are being adequately prepared for success in college, career, and life in general. Furthermore, it is essential to recognize that assessments can be problematic, introducing potential biases that disproportionately affect students in marginalized groups.11 For this reason, a well-rounded evaluation of student progress must extend beyond standardized tests, embracing a more nuanced and inclusive approach that considers multiple facets of the learning journey. To this end, California’s school accountability system includes test scores as well as other measures, such as academic performance, chronic absenteeism, school climate, college and career readiness, English learner progress, graduation rates, and suspension rates.12
Although the Smarter Balanced Assessment Consortium (SBAC) Summative Assessments evaluate only one facet of the outcomes of interest for students in California, they provide a useful tool for monitoring student learning progress since they are comprehensive, end-of-year assessments aligned with the Common Core State Standards for ELA and math that measure progress towards college and career readiness. Because students in Grades 3–8 and 11 take the SBAC test during the spring of each school year in California, the assessment scores represent the learning outcomes of all California students in these grades and allow for comparisons across grades, demographic groups, and schools/districts. These tests are computer adaptive, so they provide precise measurements across the full range of achievement13 and can be used to understand the impact of the pandemic on students more fully. We share three concerning findings from the fall 2023 release.
Analytic Notes
Both the COVID-19 pandemic and economic conditions in California have contributed to significant changes in enrollment in schools across the state. Enrollment dropped by a record 2.6 percent in 2020–21, an additional almost 2 percent in 2021–22, and almost 1 percent in 2022–23, resulting in a loss of 310,000 students statewide.14 Because of the way student test results are reported, these population changes can present some issues when comparing student performance across time. Rather than tracking the performance of an individual student, the state tests compare the performance of cohorts over time. This means that if the cohort composition changes from one year to the next, it can make inferences about comparisons difficult.
Overall, the number of students tested decreased by approximately 6 percent from 2019 to 2023 and varied by grade level. For some grades, the tested population has changed substantially: The grade cohorts with the biggest changes in counts of students tested were seventh graders (down 10 percent from 2019), eighth graders (down 9.3 percent from 2019), and third, fifth, and sixth graders (all down approximately 7 percent from 2019). Cohorts in fourth grade (down approximately 4.3 percent) and eleventh grade (down about 0.7 percent from 2019) had the smallest change in counts of students tested.
In addition, the demographic makeup of the students tested has changed overall, with some major differences by district. For example, on average, school districts15 saw an increase of 1.3 percentage points in the percentage of economically disadvantaged students from 2019 to 2023. Within districts, the changes were even more dramatic: 44.4 percent of districts saw changes of 5 percentage points or more in either direction, and 4.5 percent of districts saw larger changes of 20 percentage points or more.
Changes of this magnitude in the tested population could mean that we are comparing the test scores of very different student populations from before the pandemic and now. Future research and public reporting should use student-level growth models as that would provide a more accurate analysis of how learning has changed over time.16 Instead of comparing students in one cohort to students in the next, these growth models would analyze the impact that schools have on individual students’ learning from year to year. Although California has approved a student-level growth model, it will not be publicly reported until fall 2024 at the earliest.17 Meanwhile, every other state (except Kansas) is tracking learning progress based on student growth in test scores, with many continuing to do so even through pandemic-induced disruptions in testing.18
1. Despite Some Minor Improvements, Students’ Scores Remain Well Behind Prepandemic Cohorts
Before the COVID-19 pandemic, from 2017 to 2019, test scores in ELA and math were trending upward. In 2017, 37.6 percent of students met or exceeded standards in math, followed by 38.7 percent in 2018 and 39.7 percent in 2019. There was a similar pattern for ELA, where 48.6 percent of students met or exceeded standards in 2017, followed by 49.9 percent in 2018 and 51.1 percent in 2019. Yet between 2019 and 2022, when testing resumed after the pandemic, achievement declined precipitously, and 1 year later, scores remain far below prepandemic cohorts. Figure 1 plots the percentage of students who met or exceeded standards in ELA (blue line) and math (yellow line) annually from spring 2017 to spring 2023.19
Figure 1. Percentage of Students Meeting or Exceeding Standards in ELA and Math by Year (All Grades)
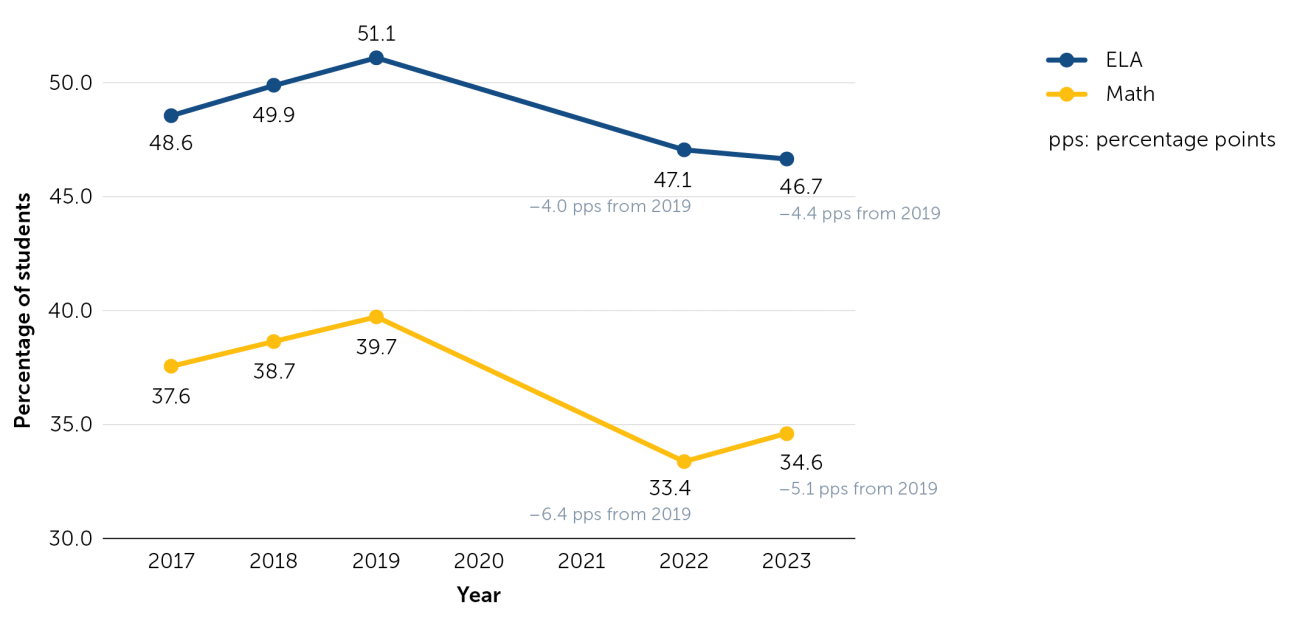
In 2023, more students met or exceeded standards in math compared to 2022, with 34.6 percent meeting the criteria, up from 33.4 percent in the previous year. However, this is still a drop of 5.1 percentage points from 2019 when 39.7 percent of students met or exceeded the standards for math.
For ELA in 2023, there was a slight decrease from the previous year in the percentage of students meeting or exceeding state standards: 46.7 percent of students met or exceeded standards, down from 47.1 percent in 2022 and 51.1 percent in 2019. This means that student cohorts in 2023 are 4.4 percentage points behind prepandemic cohorts in ELA.
2. Most Grades Declined in ELA from 2022 to 2023 and Showed Marginal Improvement in Math
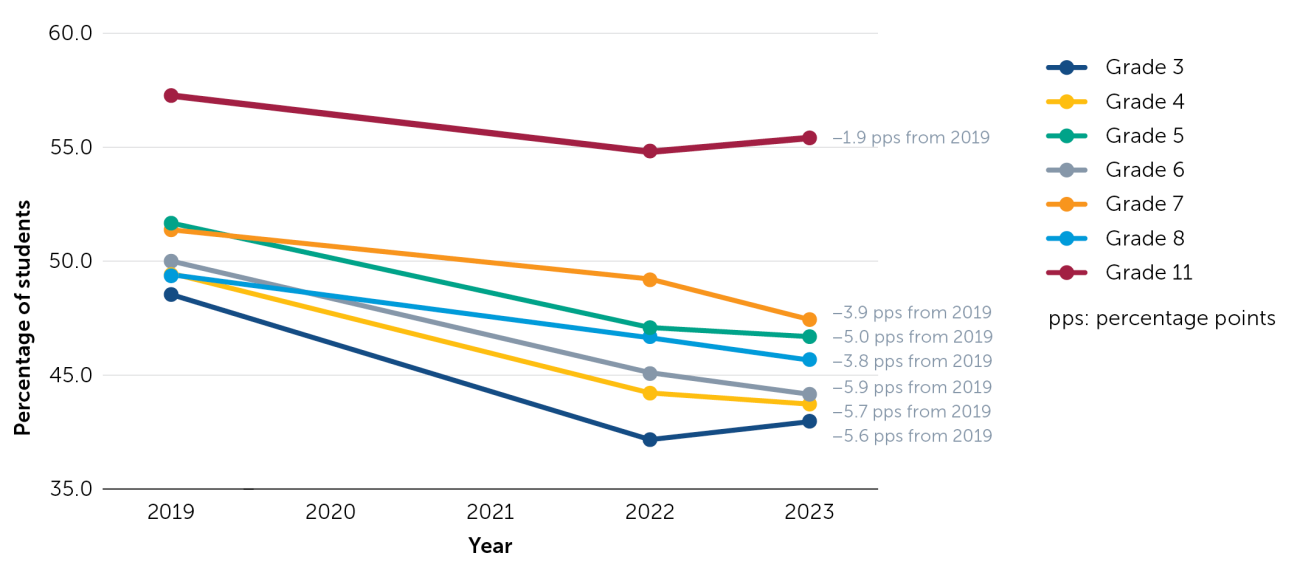
From 2019 to 2022, there were precipitous declines in all grade levels in ELA, and most cohorts (except Grades 3 and 11) had further declines from 2022 to 2023. Cohorts now are significantly behind prepandemic cohorts in ELA, with the following grades experiencing the largest declines in students who met or exceeded state standards: sixth grade (-5.9 percentage points from 2019), fourth grade (-5.7 percentage points from 2019), and third grade (-5.6 percentage points from 2019). Despite modest increases from 2022 to 2023, eleventh-grade students still had a decline of 1.9 percentage points from 2019 to 2023. (See Figure 2 and Appendix Table 1 for further detail.)
Figure 2. Percentage of Students Meeting or Exceeding Standards in ELA by Grade and Year
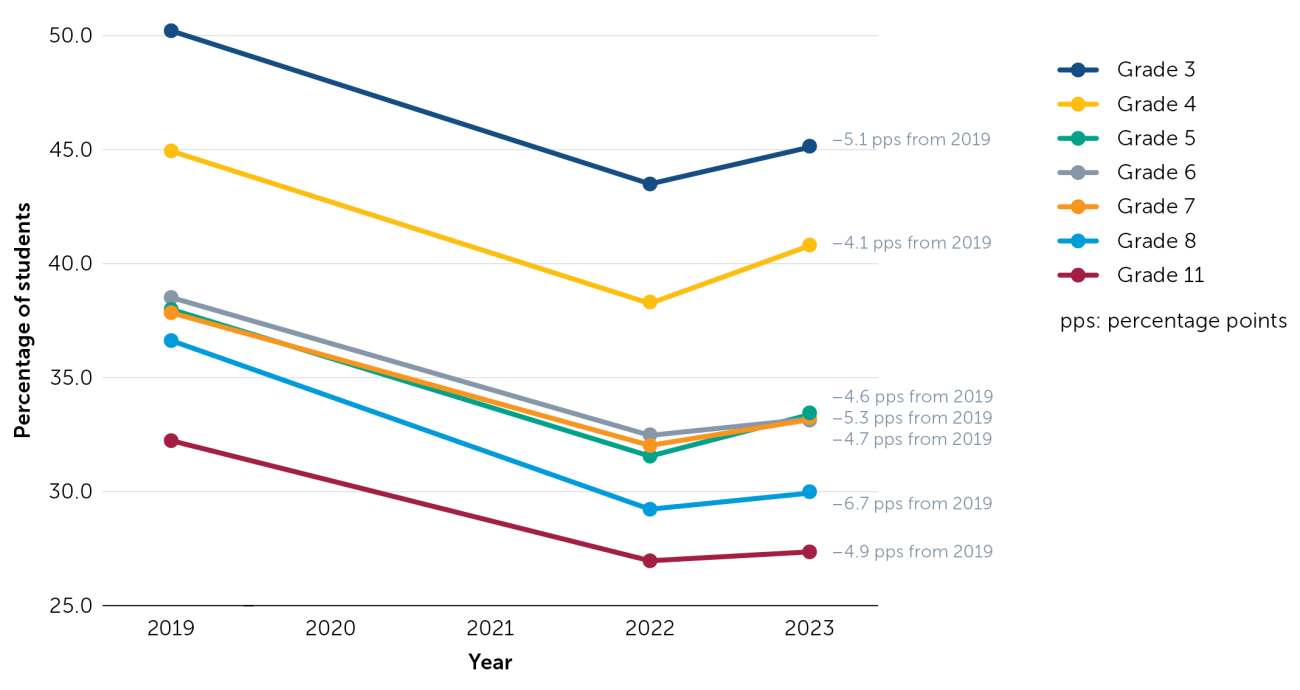
We see the same precipitous drops in math as in ELA from 2019 to 2022; however, unlike in ELA, all grades experienced modest increases in the percentage of students who met or exceeded standards in math from 2022 to 2023. Nonetheless, all grade levels remain significantly behind prepandemic levels in math, with the following grades experiencing the largest declines in students who met or exceeded state standards relative to 2019 cohorts: eighth grade (-6.7 percentage points from 2019), sixth grade (-5.3 percentage points from 2019), and third grade (-5.1 percentage points from 2019). All other grades declined by an average of 4.6 percentage points from 2019 to 2023. (See Figure 3 and Appendix Table 1 for further detail.)
Figure 3. Percentage of Students Meeting or Exceeding Standards in Math by Grade and Year
3. Vulnerable Student Groups Remain Significantly Behind
When looking at the impacts of the pandemic and related school disruptions on student achievement, it is critical to investigate how students in different groups have been affected. Figures 4 and 5 (and Appendix Tables 2 and 3) show the percentage of students in highlighted subgroups meeting or exceeding state standards for each tested year in ELA and math.
Although the difference between 2022 and 2023 is small, all student subgroups show declines in the percentage of students meeting or exceeding state standards in ELA (Figure 4). This puts all subgroups substantially behind prepandemic cohorts. The student subgroups that had the largest declines from 2019 to 2023 were students experiencing homelessness (-7.1 percentage points), students of two or more races (-5.9 percentage points), White students (-4.9 percentage points), and Hispanic/Latino students (-4.7 percentage points). As a reference, all students saw on average a drop of 4.4 percentage points between 2019 and 2023.
The disparities between subgroups persist in 2023, and the following student subgroups have substantially fewer numbers than the state average (46.7 percent) meeting or exceeding state standards in ELA: economically disadvantaged students (35.3 percent), foster youth (19.4 percent), students experiencing homelessness (25.8 percent), English learners (10.9 percent), students with disabilities (15.8 percent), Hispanic/Latino students (36.1 percent), and Black/African American students (29.9 percent).
Figure 4. Percentage of Students Meeting or Exceeding Standards in ELA by Highlighted Subgroup, 2019–2023
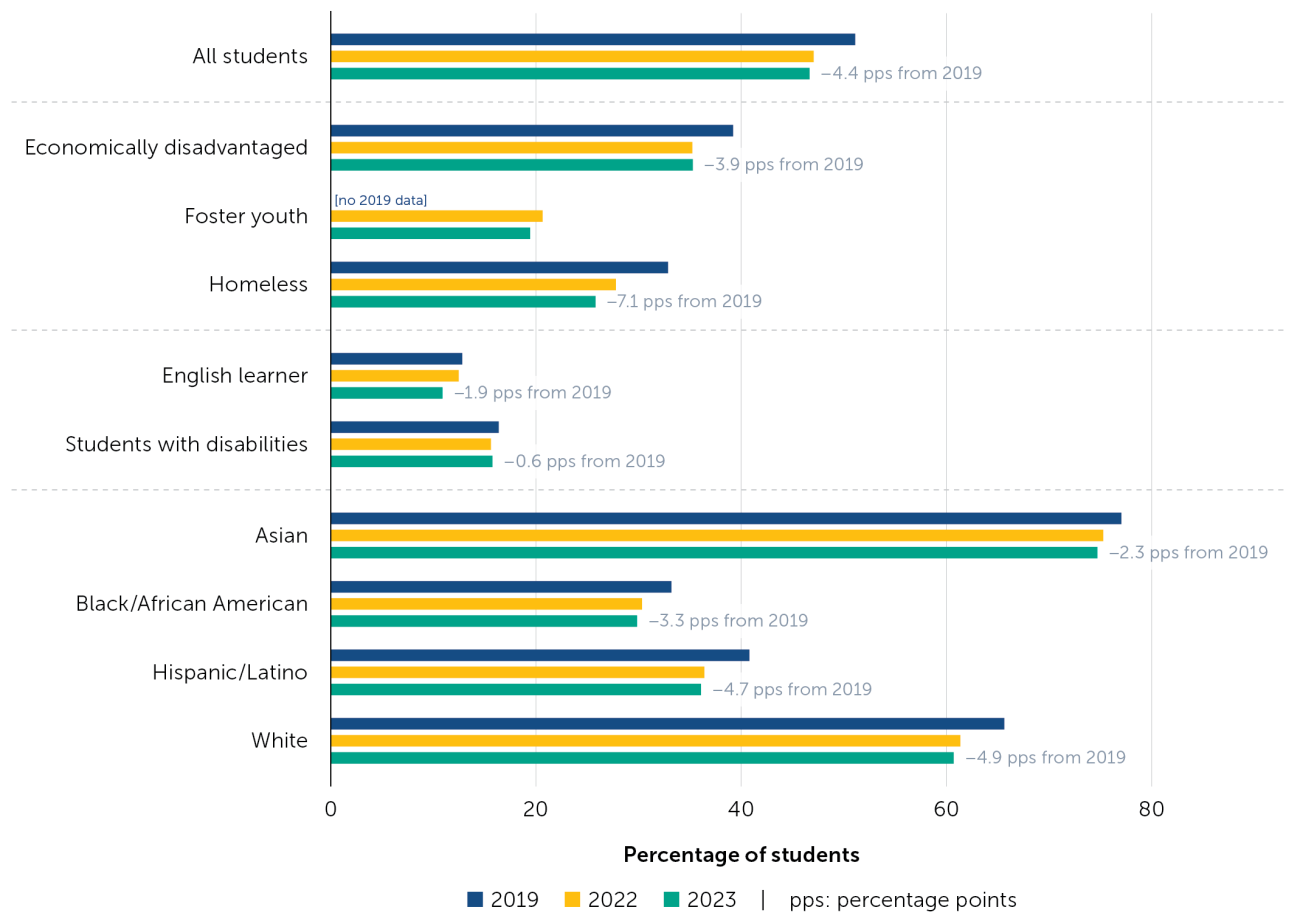
Note. Foster youth data were not tracked in 2019, so a calculation of percentage-point change between 2023 and 2019 is not possible.
In math, although the difference between 2022 and 2023 is small, all student subgroups show marginal improvements in the percentage of students meeting or exceeding state standards. For example, subgroups that showed the greatest gains from 2022 to 2023 were Filipino students (1.9 percentage points), economically disadvantaged students (1.7 percentage points), students of two or more races (1.5 percentage points), and Hispanic/Latino students (1.5 percentage points). Despite these improvements, though, all subgroups remain substantially behind prepandemic cohorts (Figure 5). Some examples of student subgroups that had the largest declines between 2019 and 2023 are students of two or more races (-6.7 percentage points), students experiencing homelessness (-6.5 percentage points), Hispanic/Latino students (-5.4 percentage points), and White students (-5.2 percentage points). All students had on average a drop of 5.1 percentage points between 2019 and 2023.
The disparities between subgroups persist in 2023, and the following student subgroups have substantially fewer students meeting or exceeding state standards in math than the state average (34.6 percent): economically disadvantaged students (22.9 percent), foster youth (10.5 percent), students experiencing homelessness (16.2 percent), English learners (9.9 percent), students with disabilities (12.3 percent), Hispanic/Latino students (22.7 percent), and Black/African American students (16.9 percent).
Figure 5. Percentage of Students Meeting or Exceeding Standards in Math by Highlighted Subgroup, 2019–2023
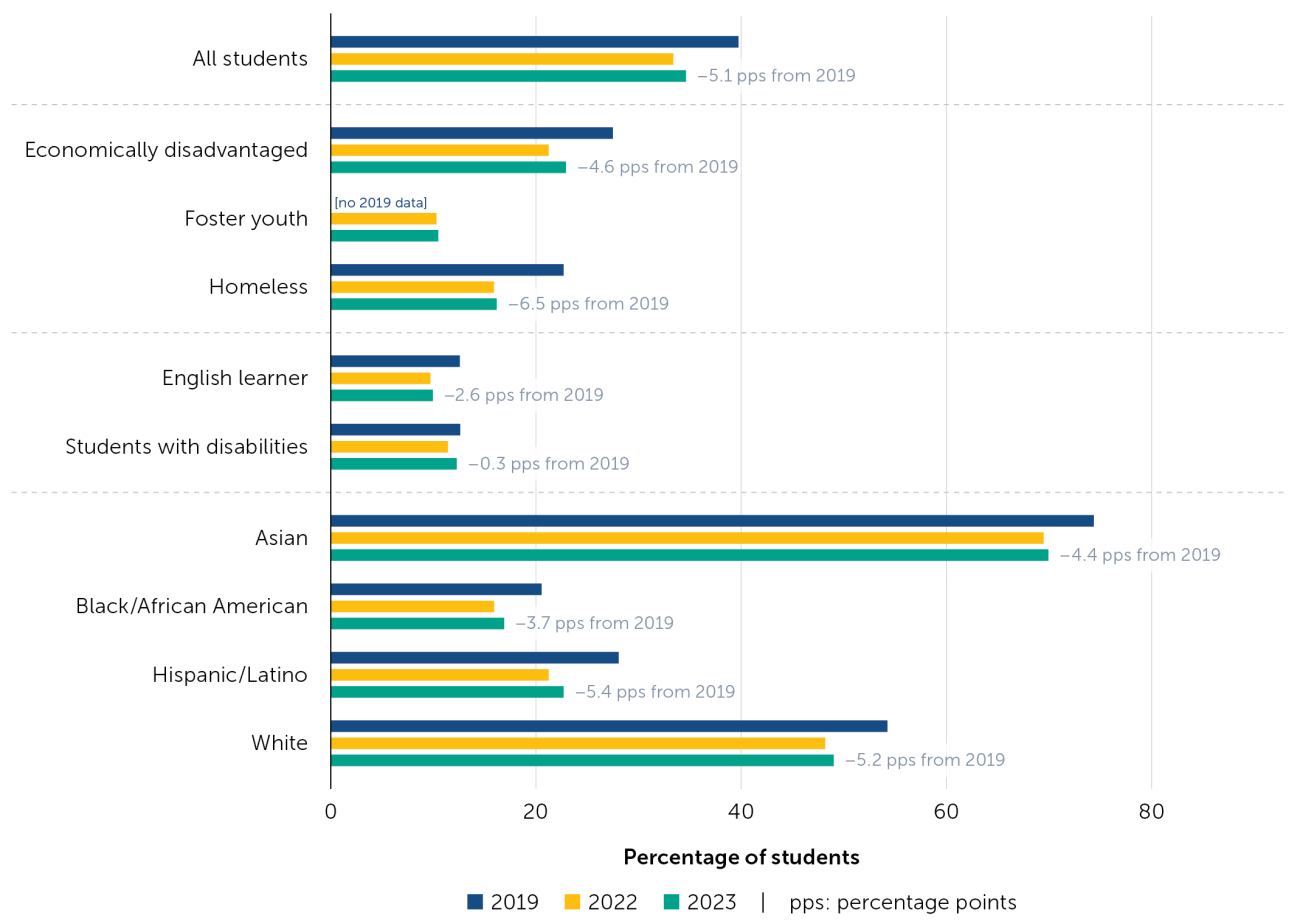
Note. Foster youth data were not tracked in 2019, so a calculation of percentage-point change between 2023 and 2019 is not possible.
Figures 4 and 5 show that there are significant gaps between student groups. However, to observe whether gaps between student groups have changed during this period, we need to use a different approach. Reporting the percentage of students meeting or exceeding proficiency is helpful because it is easy to understand, but it only demonstrates whether students have met this threshold. A scale score, however, shows the full range of student learning and how it has changed over time, and thus can provide better information about the differential impact of the pandemic on students in different groups and grades.20 For this reason, in Table 1 we replicate an analysis conducted by Andrew Ho21 to compare the cumulative impact from 2019 to 2023 on scale scores for three select racial/ethnic groups of students: Black/African American, Hispanic/ Latino, and White.
Table 1. Differences in Scale Scores From 2019 to 2023, by Grade and for Select Racial/Ethnic Groups
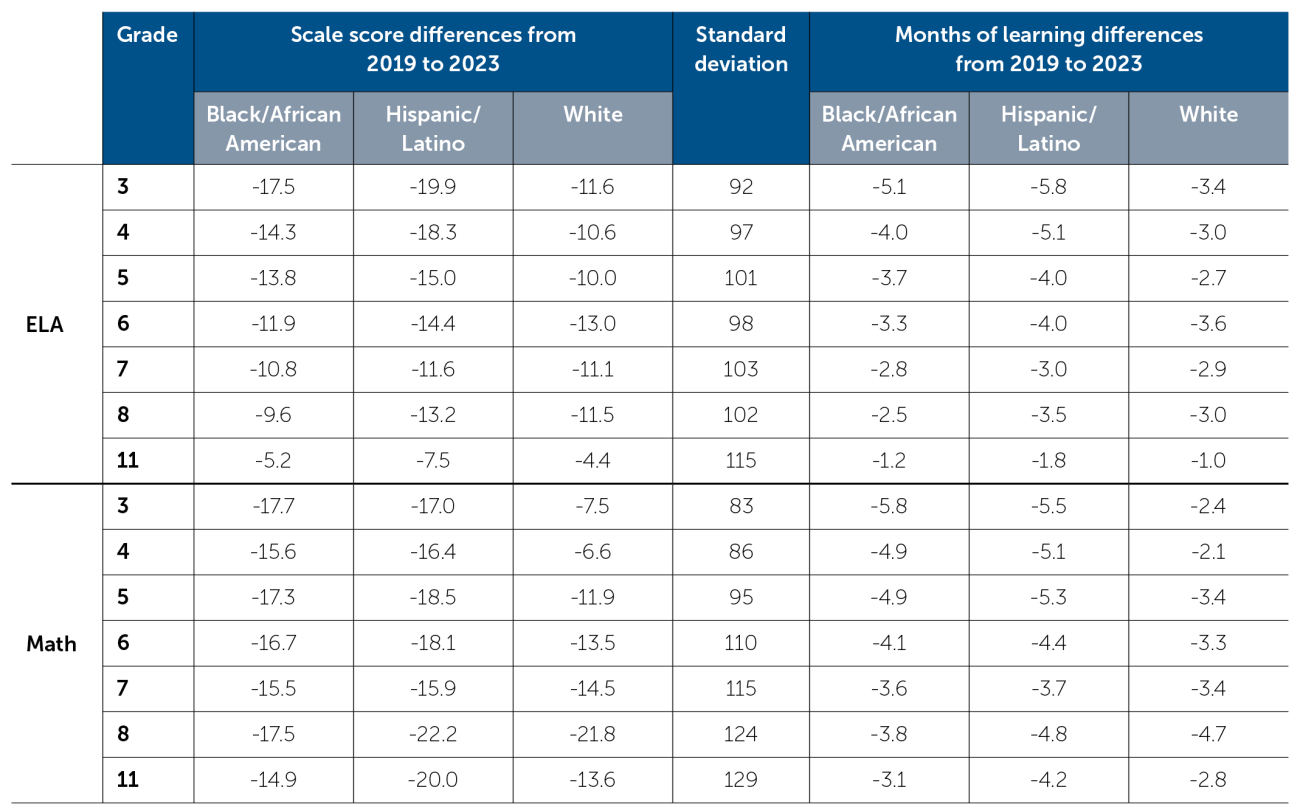
Note. The left-hand side of Table 1 shows the differences in average scale score points between 2019 and 2023, and the right-hand side shows these differences in “months of learning” units. The months of learning interpretation is the “effect size” (which is a change represented in terms of standard deviation units) multiplied by 27 as a rule of thumb. In other words, the calculation is: 27 × (scale score trend / standard deviation). Negative numbers indicate decreases in average scores from 2019 to 2023 in scale scores or months of learning. Standard deviations from 2017 are shown as references to estimate effect sizes. Informal months of learning interpretations assume linear learning rates of one third of a standard deviation over 9 months of schooling per year.
In Grade 3 ELA in 2023, Black/African American students are 18 scale score points behind their counterparts in the 2019 cohort, Hispanic/Latino students are 20 points behind, and White students are 12 points behind. In Grade 3 math, these declines were 18, 17, and 8 points for the same three groups respectively. To make these numbers easier to understand, we use a conversion to translate the scale score points into months of learning units (see table note and Figure 6).
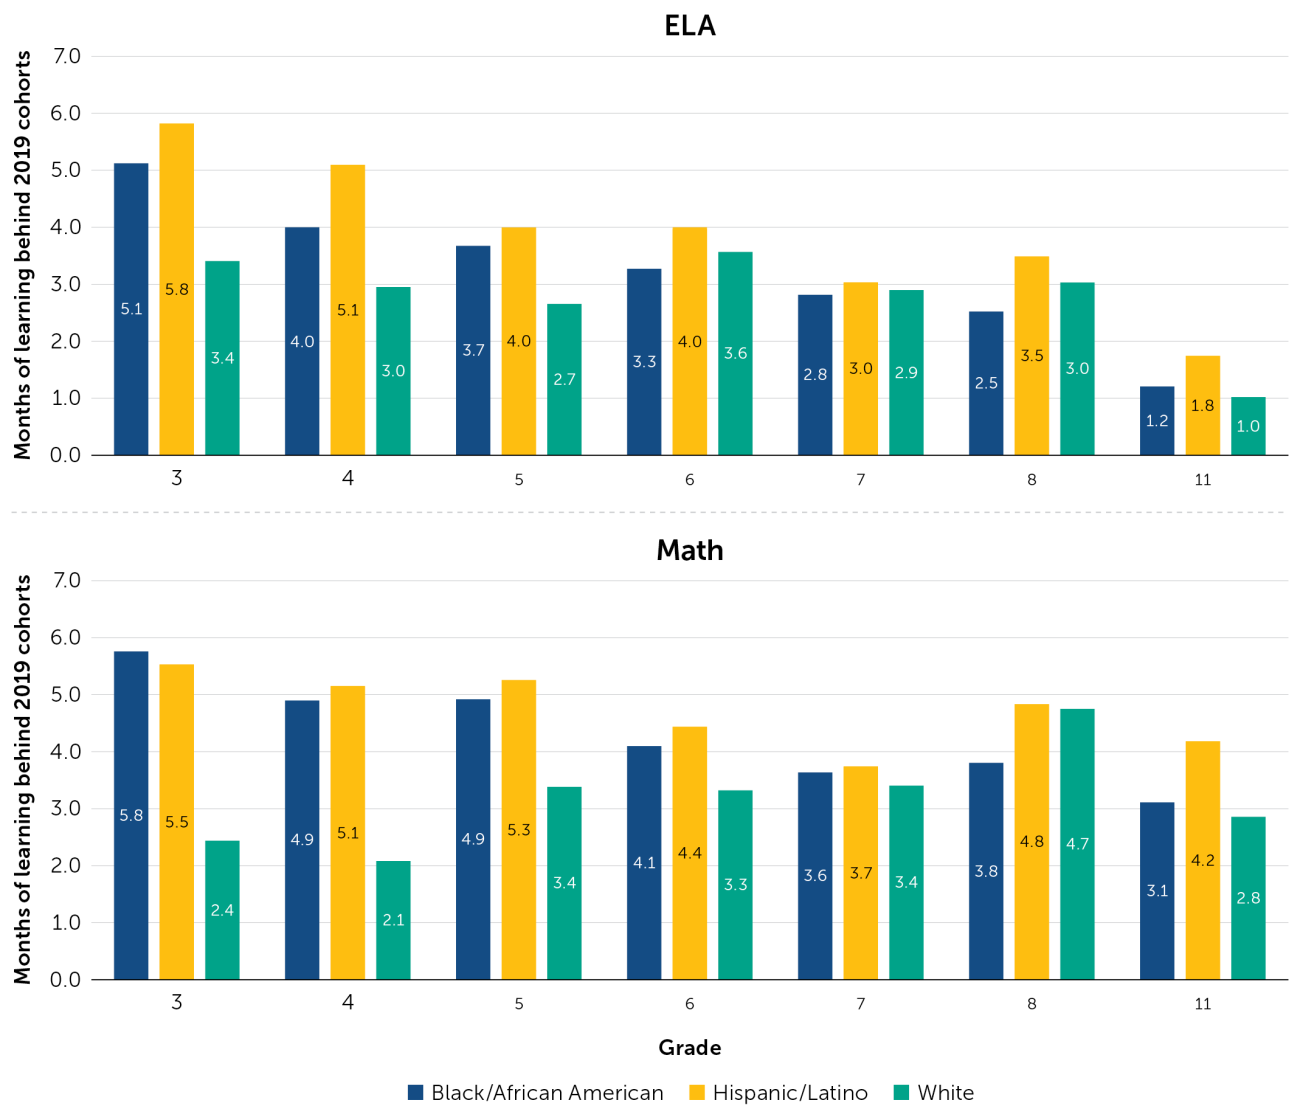
As Figure 6 shows, in both ELA and math, Black/African American and Hispanic/Latino students have fallen farther behind during the pandemic than their White cross-cohort counterparts, particularly in the early grades. For example, in third-grade ELA in 2023, Black/African American students were 5.1 months of learning behind students in the 2019 cohort, and Hispanic/Latino students were 5.8 months of learning behind, but White students were significantly less behind (only 3.4 months of learning). Similarly, in third-grade math in 2023, Black/African American students were 5.8 months of learning behind students in the 2019 cohort, and Hispanic/Latino students were 5.5 months of learning behind, but White students were only 2.4 months behind prior cohorts. In higher grades, differences between racial/ethnic groups are less pronounced.
Figure 6. Months of Learning Lost Relative to Cross-Cohort Peers for Select Racial/Ethnic Groups, 2019–2023
The widening of achievement gaps in the early grades is concerning given the importance of basic skills for future academic development. A large body of prior research has identified that a solid early foundation of literacy and mathematics is critical for students’ future academic and life success.22 These gaps in the earlier grades, if left uncorrected, will continue to widen as it becomes increasingly difficult for affected students to access future academic content and learning.
Where Do We Go From Here?
Even before the COVID-19 pandemic, we and many others in the education research community were concerned that California’s public schools were not serving all students well. The state’s education system was highly inequitable and plagued by gaps in opportunity and access that the pandemic has only widened.23
The results of the 2023 test scores are extremely troubling because they make clear that, while the decline from 2019 to 2022 was dramatic, the recovery will not be similarly dramatic. Between 2022 and 2023, scores in ELA continued to decline, and in math, scores increased only slightly. Most concerning about these scores is that they reveal so starkly the large and growing opportunity gaps between student groups. For example, only 16.9 percent of Black/African American students and 22.7 percent of Hispanic/Latino students met or exceeded standards in math compared to 49.0 percent of White students; 22.9 percent of economically disadvantaged students met or exceeded standards compared to 54.3 percent of students not in this group. These gaps are completely unacceptable and, if left unaddressed, will lead to inequitable outcomes in graduation rates, college access, future wages, and even life expectancy.24
If California’s leaders are committed to accelerating learning, we recommend taking a very serious look at the systemic problems facing our schools. California’s teachers have been working relentlessly to serve students, but their job has gotten much harder in the wake of the pandemic. For example, a critical issue that must be addressed is California’s chronic absenteeism problem. During 2022–23, 24.9 percent of students in California’s K–12 schools were chronically absent, meaning they missed 10 percent or more of school days.25 This functionally means that in most classrooms, teachers rarely have a fully present class, and every day they must catch students up on missed work and lessons before being able to “accelerate learning.”
There also are not enough adults working in schools, which compounds the problem. Federal and state dollars for recovery could have been used for staffing, and indeed, districts had thousands of open positions for aides, subs, attendance coordinators, and the like but struggled to fill those positions, largely because of low pay and the absence of trained personnel to serve in the new roles. This meant that the job of teaching students became a lot harder after the pandemic, but teachers in most places had little additional support to address student needs. This has led to difficult working conditions, staff dissatisfaction, and increasing turnover,26 exacerbating already-serious teaching shortages in critical subjects like special education, math, science, and bilingual education as well as in schools serving low-income students and students of color.
These patterns must be disrupted, and urgently. We need to improve the conditions for teaching and learning statewide and work to make our schools places where students feel motivated and engaged and where teachers feel empowered and effective. Leaders across the state must act now to build the capacity within schools so that educators can quickly diagnose and collectively respond to students’ needs. To this end, powerful models are being implemented across the state, such as the Intensive Assistance Model (IAM) pilot being led by the California Collaborative for Educational Excellence; this model uses an intensive support and coaching process to empower teachers as instructional leaders by developing processes, structures, and cultures that support collaborative planning, data analysis, and targeted interventions.27 The effective implementation of this, or any, approach to school improvement requires the active engagement of district offices to align resources, remove barriers, and support effective teaching and learning systems as well as a focus on strengthening and aligning systems at the school, district, county, and state levels to center student learning and educator support. We will only make progress on improving these poor outcomes through collaborative problem-solving and shared accountability for transforming our systems.
Appendix Tables
The following tables detail the percentage of students who met or exceeded state standards annually from the years 2017 to 2023, by subject and by grade.
Table 1. Percentages of Students Who Met or Exceeded Standards by Grade, Year, and Subject
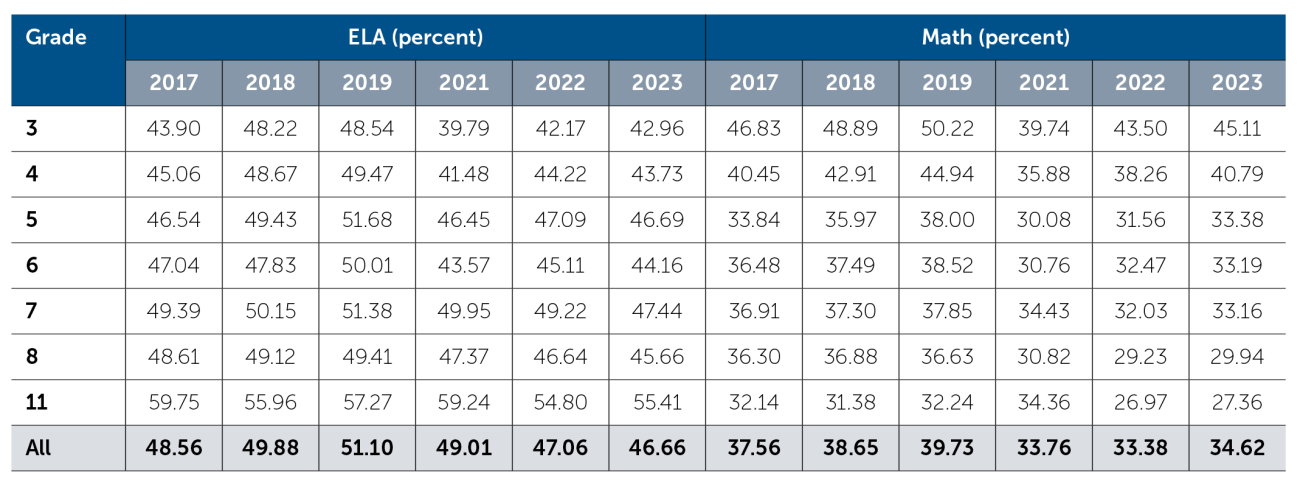
Table 2. Percentages of Students Who Met or Exceeded Standards in ELA in Years 2019, 2022, and 2023 by Subgroup
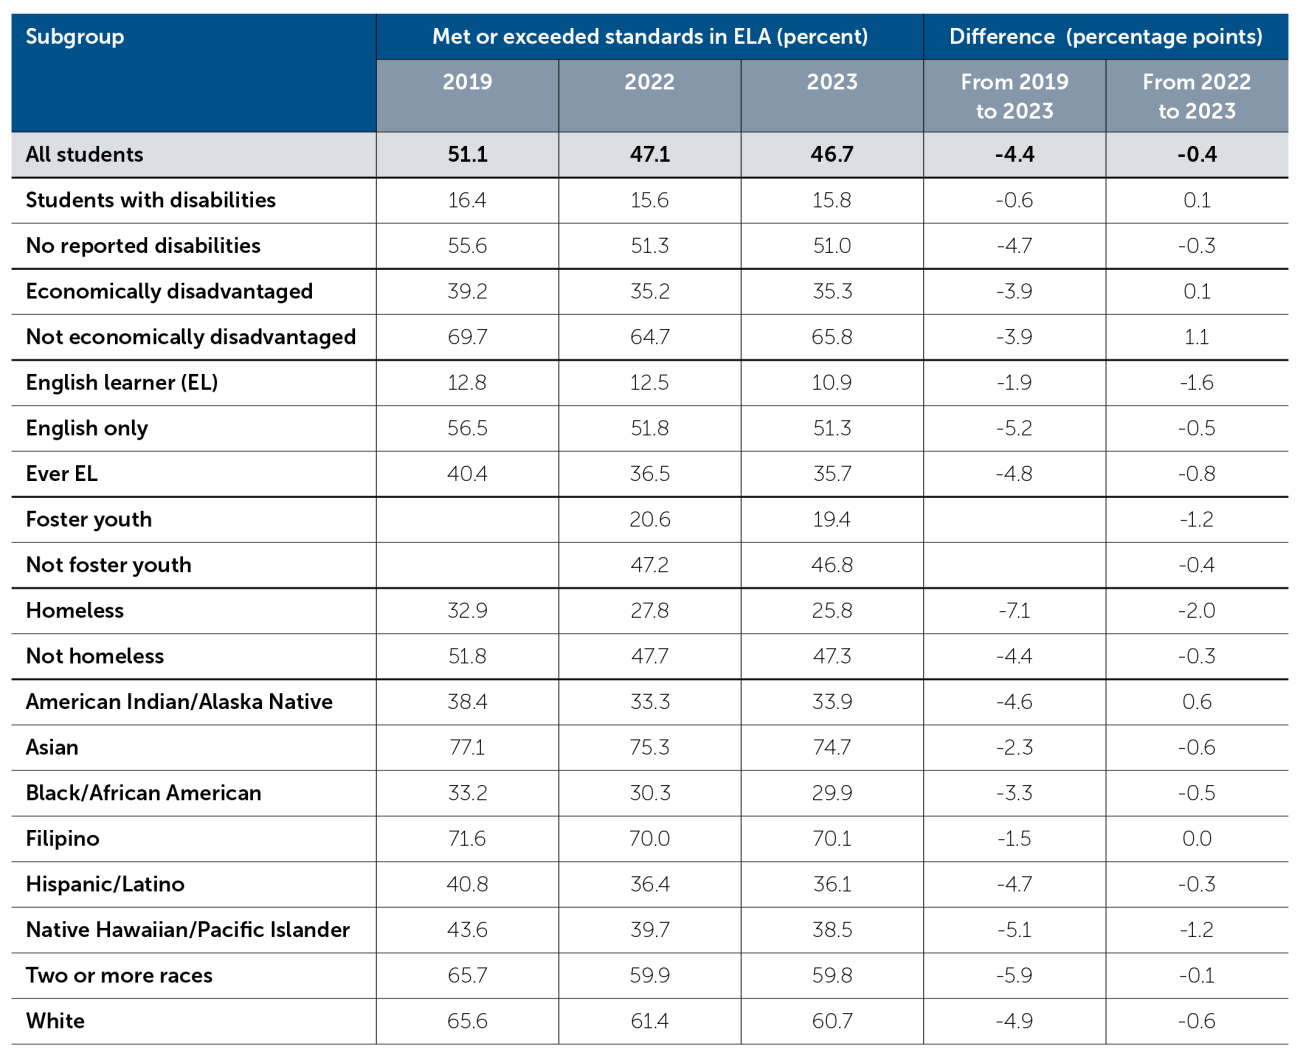
Table 3. Percentage of Students Who Met or Exceeded Standards in Math in Years 2019, 2022, and 2023 by Subgroup

Hough, H. J., & Chavez, B. (2024, January). California test scores show little improvement after pandemic [Policy brief]. Policy Analysis for California Education. https://edpolicyinca.org/publications/california-test-scores-show-little-improvement-after-pandemic
- 1Hough, H. J., et al. (2021, September). The impact of the COVID-19 pandemic on students and educational systems: Critical actions for recovery and the role of research in the years ahead [Commissioned paper]. Policy Analysis for California Education. edpolicyinca.org/publications/impact-covid-19-pandemic-students-and-educational-systems
- 2Tai, D. B. G., Shah, A., Doubeni, C. A., Sia, I. G., & Wieland, M. L. (2021). The disproportionate impact of COVID-19 on racial and ethnic minorities in the United States. Clinical Infectious Diseases, 72(4), 703–706. doi.org/10.1093/cid/ciaa815; Fortuna, L. R., Tolou-Shams, M., Robles-Ramamurthy, B., & Porche, M. V. (2020). Inequity and the disproportionate impact of COVID-19 on communities of color in the United States: The need for a trauma-informed social justice response. Psychological Trauma: Theory, Research, Practice, and Policy, 12(5), 443–445. doi.org/10.1037/tra0000889
- 3Aguilar, S. J., Galperin, H., Baek, C., & Gonzalez, E. (2020, October). When school comes home: How low-income families are adapting to distance learning. EdArXiv. doi.org/10.35542/osf.io/su8wk; Polikoff, M., Saavedra, A. R., & Korn, S. (2020, May 8). Not all kids have computers—and they’re being left behind with schools closed by the coronavirus. The Conversation. theconversation.com/not-all-kids-have-computers-and-theyre-being-left-behind-with-schools-closed-by-the-coronavirus-137359
- 4Newsom, G. (n.d.). Newsom’s plan to transform public schools into gateways of opportunity (TK–12 Education Fact Sheet). Office of Governor Gavin Newsom. gov.ca.gov/wp-content/uploads/2021/05/TK-12-Education-Fact-Sheet.pdf?emrc=c7bb9a
- 5Jordan, P. W. (2022, December 29). What congressional funding means for K–12 schools. FutureEd. future-ed.org/whatcongressional-covid-funding-means-for-k-12-schools
- 6Hong, J. (2022, March 17). Short-term fixes won’t really solve California’s teacher shortage. CalMatters. calmatters.org/education/k-12-education/2022/03/california-teacher-shortage
- 7Myung, J., & Hough, H. J. (2023, November). Why aren’t students showing up for school? Understanding the complexity behind rising rates of chronic absenteeism [Commentary]. Policy Analysis for California Education. edpolicyinca.org/newsroom/why-arent-students-showing-school
- 8Mustala, S., & Cha, P. (2022, December 5). Investing in schools to address COVID-19’s toll on youth mental health. Public Policy Institute of California Blog. ppic.org/blog/investing-in-schools-to-address-covid-19s-toll-on-youth-mental-health
- 9Mueller, S. (2023, November 5). School board elections are latest battleground for polarized national politics. Capradio, NPR.
capradio.org/news/npr/story?storyid=1210672666 - 10Will, M. (2023, October 30). Teacher strikes, explained: Recent strikes, where they’re illegal, and more. Education Week. edweek.org/teaching-learning/teacher-strikes-explained-recent-strikes-where-theyre-illegal-and-more/2023/10
- 11Fairness in educational assessment and the next edition of the standards [Special issue]. (2023). Educational Assessment, 28(2). tandfonline.com/toc/heda20/28/2
- 12California Department of Education. (n.d.). LCFF priorities/whole child resource map. cde.ca.gov/eo/in/lcff1sys-resources.asp
- 13California Department of Education. (n.d.). Smarter balanced summative assessments. cde.ca.gov/ta/tg/s/sbacsummative.asp
- 14California Department of Education. (2023). Enrollment multi-year summary by grade: State report [data set]. DataQuest. dq.cde.ca.gov/dataquest/dqcensus/EnrGrdYears.aspx?cds=00&agglevel=state&year=2022-23
- 15Unified, elementary, and high school districts were included in this analysis.
- 16Polikoff, M. (2019, September). On growth models, time for California to show some improvement [Policy brief]. Policy Analysis for California Education. edpolicyinca.org/publications/growth-models-time-california-show-improvement
- 17California Department of Education. (n.d.). Growth model. cde.ca.gov/ta/ac/acctgrowthmod.asp
- 18Gill, B. (2022, February 18). States: Don’t give up on measuring student growth for 2022 accountability! Regional Educational Laboratory Blog. ies.ed.gov/ncee/rel; Klein, A. (2019, January 23). How are states measuring student growth under ESSA? Education Week. edweek.org/education/how-are-states-measuring-student-growth-under-essa/2019/01
- 19Students were not tested in 2020, and participation was optional in 2021, which is why data from those years are missing from
the figure. - 20Ho, A. D. (2008). The problem with “proficiency”: Limitations of statistics and policy under No Child Left Behind. Educational Researcher, 37(6), 351–360. doi.org/10.3102/0013189X08323842
- 21Cayla, J., et al. v. State of California, et al., Los Angeles Sup. Ct. RG20084386 (2023). Expert report of Andrew Ho, PhD.
scholar.harvard.edu/sites/scholar.harvard.edu/files/andrewho/files/andrew_ho_cayla_j_expert_report_combined_v03.pdf. An addendum makes corrections to the report’s data: scholar.harvard.edu/sites/scholar.harvard.edu/files/andrewho/files/andrew_ho_cayla_j_expert_report_2023_addendum.pdf - 22Regional Educational Laboratory West. (2017, May 1). The relationship between math performance in grades 3–8 and later academic outcomes. Ask a REL Blog. ies.ed.gov/ncee/rel/Products/Region/west/Ask-A-REL/100102; Annie E. Casey Foundation. (2010, January 1). Early warning! Why reading by the end of third grade matters [Report]. aecf.org/resources/early-warning-why-reading-by-the-end-of-third-grade-matters
- 23Reimagine and Rebuild California Schools Project. (2021). Reimagine and rebuild California schools: Restarting school with equity at the center. reimaginecaschools.org
- 24Chetty, R., et al. (2011). How does your kindergarten classroom affect your earnings? Evidence from Project Star. The Quarterly
Journal of Economics, 126(4), 1593–1660. doi.org/10.1093/qje/qjr041; Heckman, J. J., Stixrud, J., & Urzua, S. (2006). The effects of cognitive and noncognitive abilities on labor market outcomes and social behavior. Journal of Labor Economics, 24(3). doi.org/10.1086/504455; Chamberlain, G. E. (2013). Predictive effects of teachers and schools on test scores, college attendance, and earnings. PNAS, 110(43). doi.org/10.1073/pnas.1315746110; Goldhaber, D., & Özek, U. (2019). How much should we rely on student test achievement as a measure of success? Educational Researcher, 48(7), 479–483. doi.org/10.3102/0013189X19874061 - 25Myung & Hough, 2023.
- 26Carver-Thomas, D., Burns, D., Leung-Gagné, M., & Ondrasek, N. (2022, January 26). Teacher shortages during the pandemic: How California districts are responding [Report]. Learning Policy Institute. learningpolicyinstitute.org/product/californiateacher-shortages-response-report
- 27Cottingham, B. W., Hough, H. J., & Myung, J. (2023, December). What does it take to accelerate the learning of every child? Early insights from a CCEE school-improvement pilot [Report]. Policy Analysis for California Education. edpolicyinca.org/publications/what-does-it-take-accelerate-learning-every-child