The Effects of Absenteeism on Academic and Social-Emotional Outcomes


Summary
In March 2020, most schools in the U.S. transitioned to distance learning. During the transition a significant number of students did not fully engage in learning opportunities. This brief uses administrative panel data from the CORE Districts in California to approximate the impact of the pandemic by analyzing how absenteeism has affected student outcomes in the recent past. We show wide variation in absenteeism impacts on academic and social-emotional outcomes by grade and subgroup, as well as the cumulative effect of different degrees of absence. Student outcomes generally suffer more from absenteeism in mathematics than in English language arts. Negative effects are larger in middle school. Absences also negatively affect social-emotional development, which can affect other student outcomes down the line.
Introduction
In March 2020, the COVID-19 pandemic forced schools around the nation to close physical campuses and shift to distance learning. Existing inequalities were made starkly evident in this transition: low-poverty schools and students were able to engage in online participation quickly, while students of color in high-poverty schools and English learners (ELs) lagged behind. For example, a report by the Los Angeles Unified School District tracked the online engagement of secondary school students in an instructional app between between March 16 and May 22, 2020, and found that participation increased over time but never reached 100 percent and was lower for students in particular subgroups such as low-income students, ELs, students with disabilities (SWDs), and homeless and foster youth (HL/FST).
Given the considerable disruption caused by COVID-19 and the deep inequalities present in our school systems, schools around the nation face urgent questions: How much learning and social-emotional development has been lost due to the COVID-19 pandemic? How have different student subgroups been affected? We use data on K–12 students in the CORE Districts—a nonprofit collaborative of California school districts focused on data-driven school improvement—in California from 2014–15 to 2017–18 to understand (a) average patterns of absenteeism during regular school years for all students and by subgroup as well as (b) the impact of being away from school on test scores and social-emotional learning (SEL). Results from this analysis suggest what the effects of COVID-19 could be on student outcomes. It is safe to assume that, when schools closed in March 2020, student absenteeism was above what it normally is—at least in the few weeks immediately following the closures. Students who were consistently absent from March through June would have missed 10 weeks of school (50 days), putting them at the far end of the normal absenteeism spectrum. The analysis presented here gives some indication of the negative impact these different degrees of absenteeism would have on academic and SEL outcomes.
Absenteeism Rates During the School Year Are Generally Low
On average, students in K–12 are absent from school 7.4 days in a regular school year. Absences vary by grade, however: elementary and middle school students spend about 7 days away from school in a regular school year, whereas middle school and high school students are absent 6 and 9 days on average every school year, respectively. Absences are highest for Grades 10 through 12, with 12th graders absent an average of 10.8 days. In a typical year, approximately 14 percent of students are absent 0 days, 65 percent are absent 1 to 10 days, 13 percent are absent 11 to 18 days, and 8 percent are absent 18 days or more—the level at which absenteeism is considered chronic. Chronic absence is more prevalent in Grades 9–12 than in the earlier grades. About 7 percent of students are absent from school 30 days or more in any given year, indicating that most chronically absent students are absent for periods much longer than 18 days.
Absenteeism rates also vary considerably by student subgroup (see Figure 1). SWDs and HL/FST have the highest absenteeism rates across almost all grades. Absenteeism rates for EL and free-and-reduced-price lunch eligible (FRPL) students are fairly low in elementary school and high in the secondary grades.
Figure 1. Mean Days Absent by Subgroup and Grade
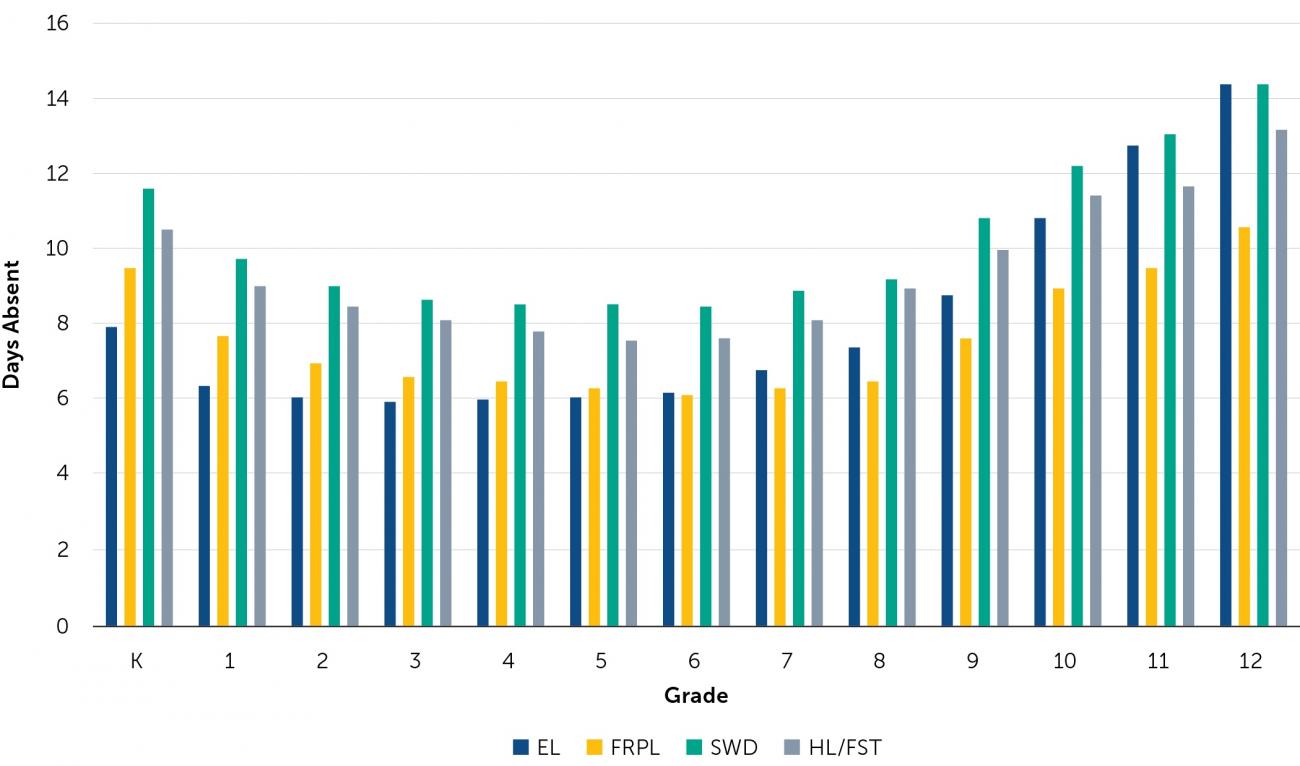
Note. Averages over 2014–15 to 2017–18 school years. Includes data from six CORE districts.
In terms of race and ethnicity, Black students have the most absences of any group (see Figure 2). Latinx students report high average absence rates in high school, but are one of the groups with the lowest average absenteeism rate in elementary and middle school. Asian American and Pacific Islander American students report the lowest number of absences of all racial and ethnic groups, across all grades.
Figure 2. Mean Days Absent by Race/Ethnicity and Grade
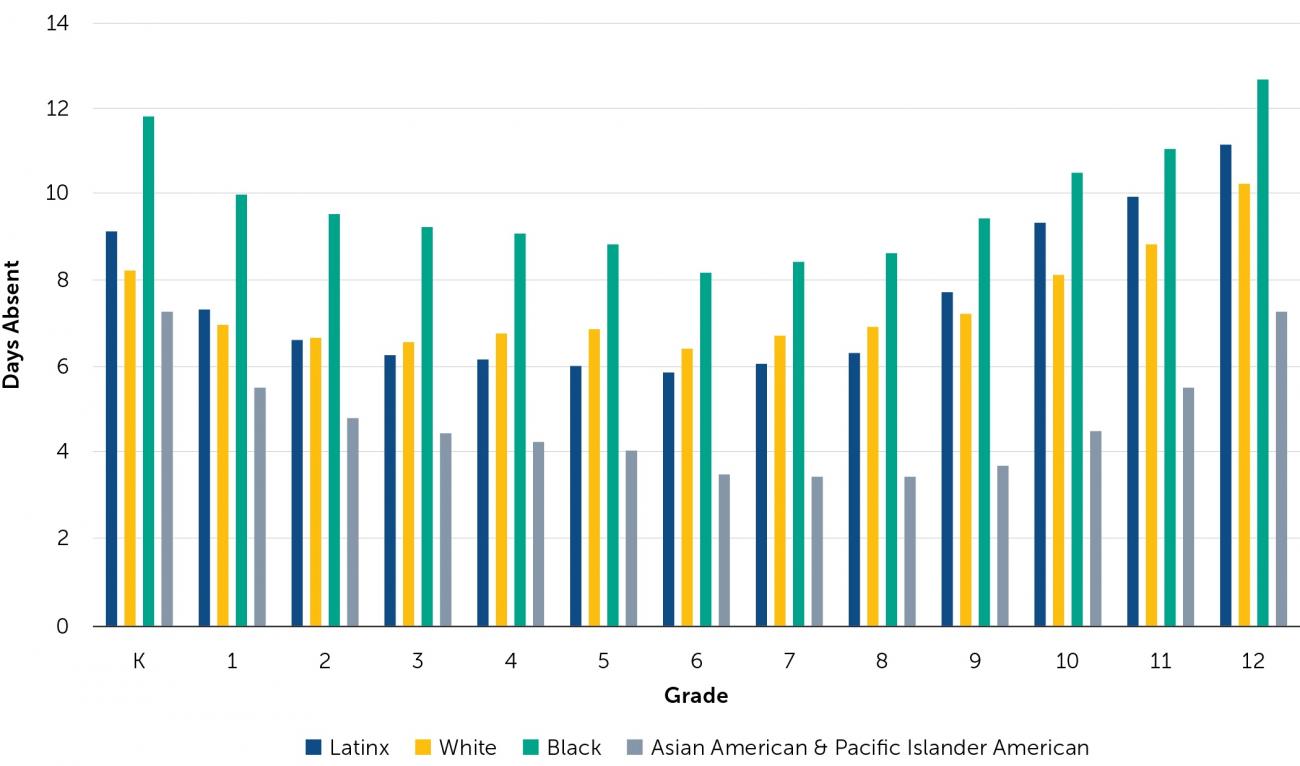
Note. Averages over 2014–15 to 2017–18 school years. Includes data from six CORE districts.
Absences Negatively Impact Test Scores
Studying the impact of absenteeism on test scores is challenging because unobserved factors could affect both absenteeism and student outcomes. For example, students who are likely to be absent more often may face circumstances causing them to exhibit behaviors (e.g., lack of motivation) that also hurt test scores. To account for unobserved factors that are specific to students and are persistent over time, we use a student fixed effect model that essentially isolates the effect of absences on outcomes for each individual student. We present our findings in graphical displays of predicted effects on mathematics and English Language Arts (ELA) scores in the Smarter Balanced Assessments (SBAC) by various levels of absenteeism. In our test score analyses, we use Grades 3–8 and exclude Grade 11 because of data limitations.
Our results suggest absences have a clear negative effect on test scores. Figure 3 shows the predicted effect on SBAC scaled test scores of students being absent at different intervals (10 days, 20 days, etc.). It clearly shows that as absences increase, test scores decrease, and they do so more rapidly for mathematics than for ELA.
Figure 3. Predicted Effects of Days Absent on Test Scores
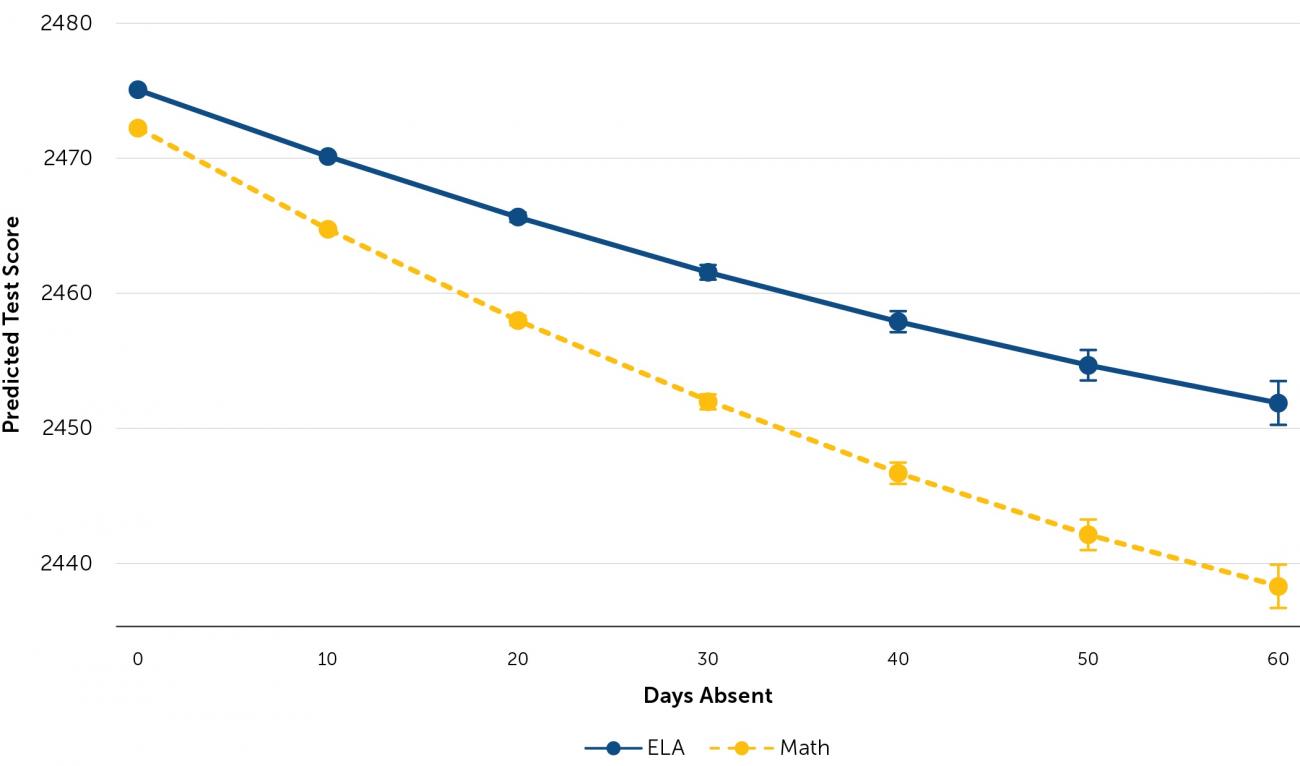
Note. Graph points represent the predicted outcome (SBAC test score, y-axis) for a given value of days absent (0, 10, 20, etc., x-axis). Confidence intervals of 95% around prediction mean. Data cover six CORE districts, 2014–15 to 2017–18.
Absences affect test scores differently depending on the school level (see Figure 4). The slopes on the grade lines show a steeper downward trend in middle school indicating that academic loss due to extended absences is felt more heavily by middle school students. In both elementary and middle school, the decline in test scores due to prolonged absenteeism is steeper in mathematics than ELA.
Figure 4. Predicted Effects of Days Absent on Test Scores, by School Grade Level
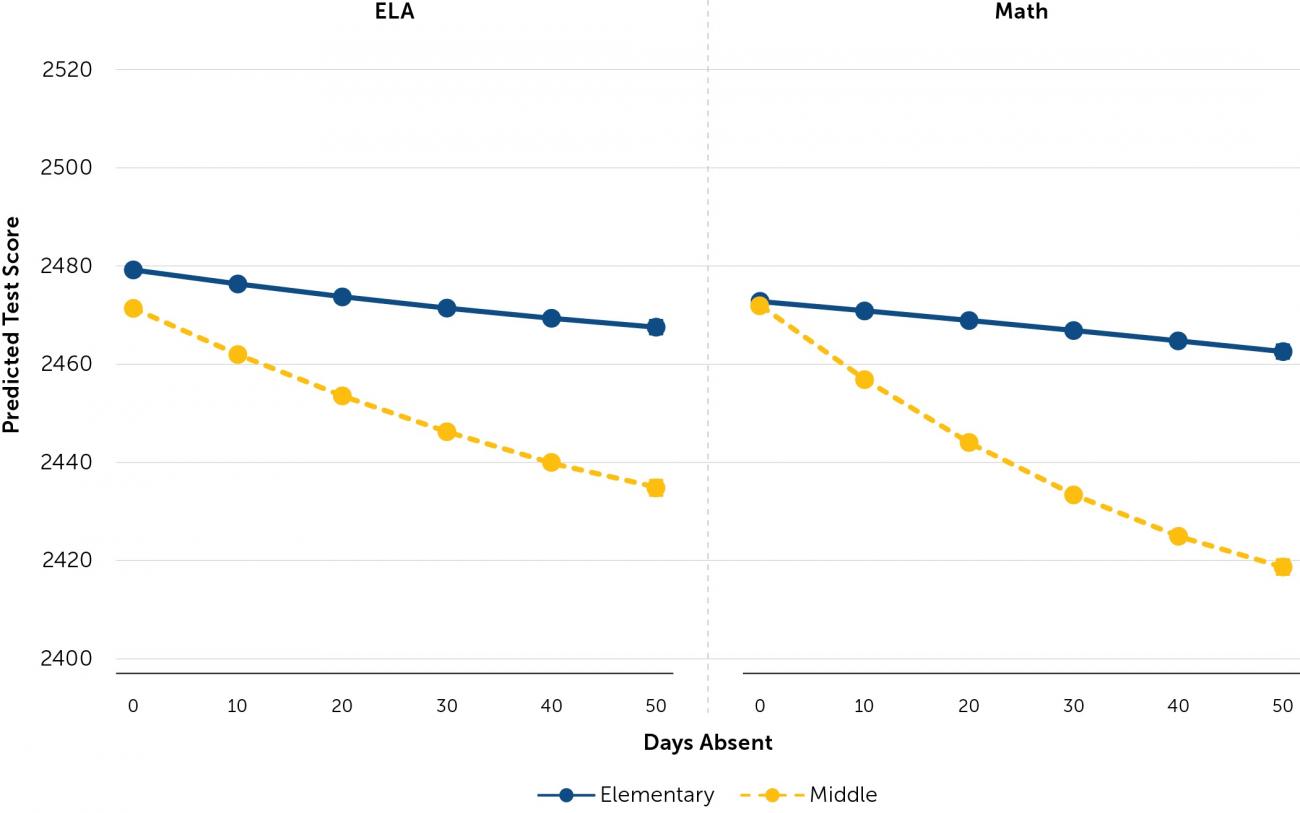
Note. Graph points represent the predicted outcome (SBAC test score, y-axis) for a given value of days absent (0, 10, 20, etc., x-axis). Confidence intervals of 95% around prediction mean. Data cover six CORE districts, 2014–15 to 2017–18.
Absences Affect Test Scores of Some Student Subgroups More Than Others
Absences hurt the academic achievement of vulnerable students more than they do other students. Predicted effects for students classified as FRPL, EL, SWD, and HL/FST can be found in Figure 5. For comparison, we add a category of “non-vulnerable” students (NONVUL)—that is, students who are not in one of those groups. The negative effects of absenteeism are substantial for all students and are the most pronounced for students classified as FRPL, SWD, and HL/FST. These findings are concerning, given that in our analytic sample, 77 percent of the student population is classified as FRPL, 13 percent as SWD, and 4 percent as HL/FST. ELs (18 percent of sample students) are an exception, as they are less affected even than non-vulnerable students (19 percent). It should be noted that this group includes students who are considered long-term ELs, newcomer ELs, and ELs at various stages of English language development. More research is needed on variation within this subgroup to better understand these effects.
Figure 5. Predicted Effects of Days Absent on Test Scores, by Subgroup
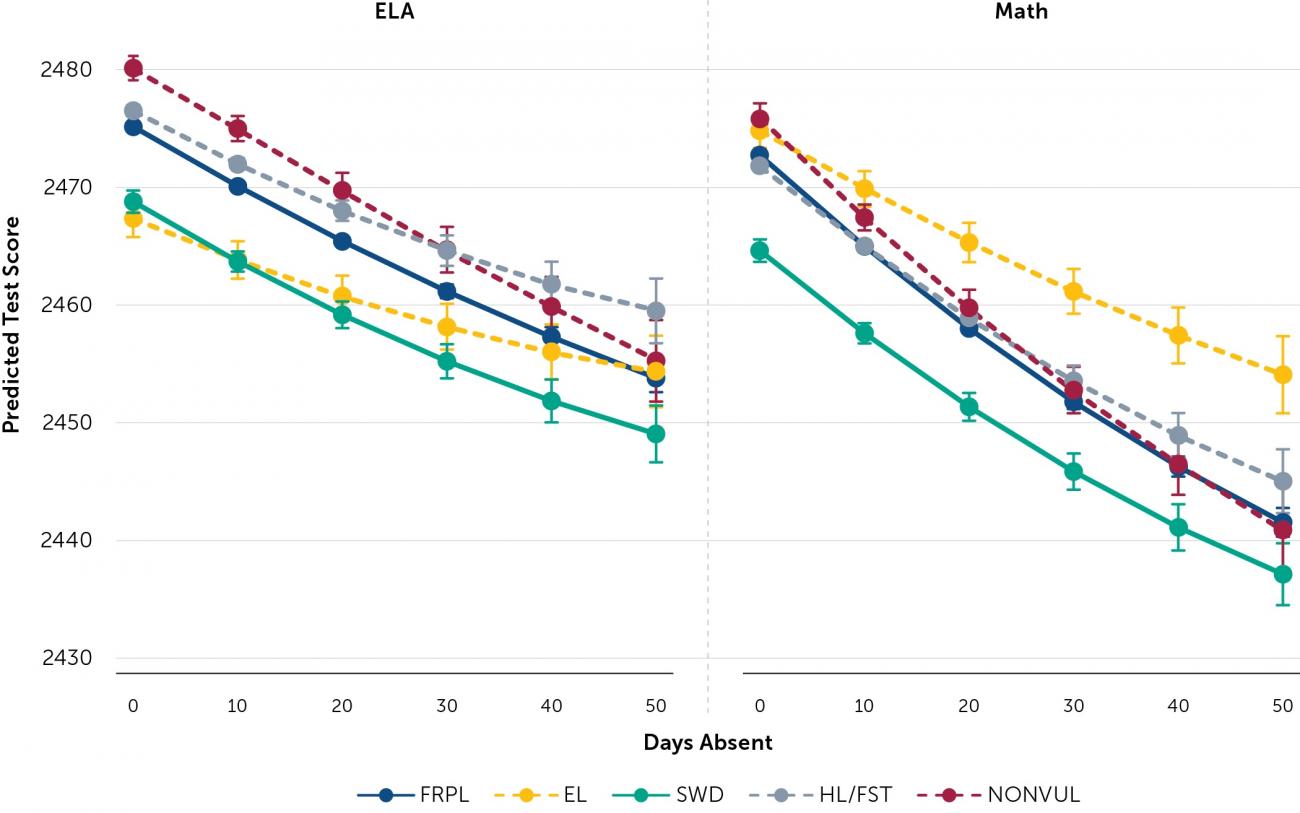
Note. Graph points represent the predicted outcome (SBAC test score, y-axis) for a given value of days absent (0, 10, 20, etc., x-axis). Confidence intervals of 95% around prediction mean. Data cover six CORE districts, 2014–15 to 2017–18.
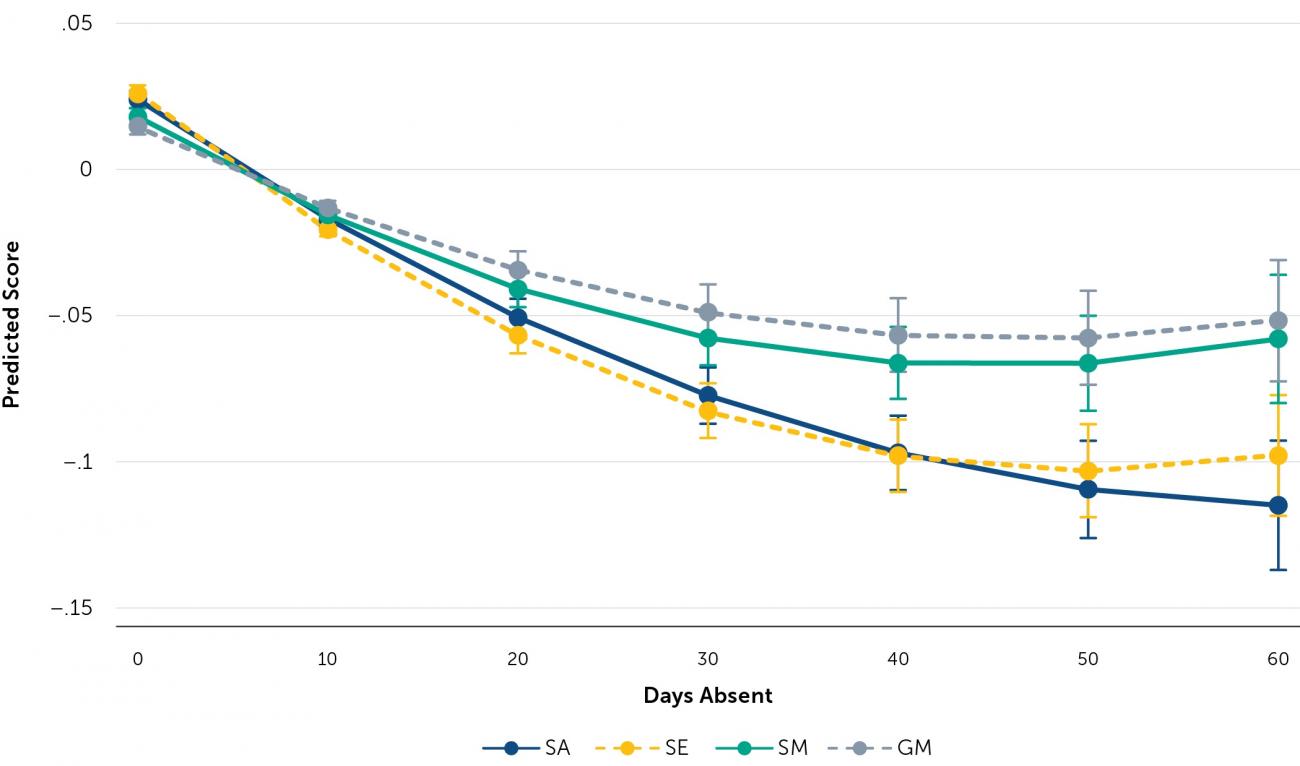
Absences Hurt Social-Emotional Outcomes
When SEL outcomes improve, so do test scores and behavioral outcomes—this is true across student subgroups and regardless of the baseline level of SEL. We study the effects of absenteeism on SEL outcomes using a similar method as above, but instead of ELA and mathematics test scores as outcome measures, we use SEL scale scores, standardized by year, for four different constructs: growth mindset (GM), social awareness (SA), self-efficacy (SE), and self-management (SM). SEL scores are based on self-reported surveys of students in Grades 4 through 12, and all of those grades are included in the analysis. Predicted effects on SEL constructs of being absent at various absenteeism levels are shown in Figure 6. Here, we see how as absences grow (x-axis), the expected (predicted) SEL outcomes decrease (y-axis). Absences harm all four SEL constructs, with slight variation across the constructs. After an initial slide, effects for most constructs flatten out after 40 days. However, for SA the decline is more or less linear, indicating a steeper rate of loss on this construct as absenteeism accumulates. Absences hurt SEL development for all student subgroups and harm SA and SE more or less equally across subgroups. They also harm non-vulnerable students more than others in SM, and non-vulnerable students and SWDs slightly more than others in GM.
Figure 6. Predicted Effects of Days Absent on Social-Emotional Outcomes
Note. Graph points represent the predicted outcome (construct score, y-axis) for a given value of days absent (0, 10, 20, etc., x-axis). Confidence intervals of 95% around prediction mean. Data cover four CORE districts, 2014–15 to 2017–18.
There are differences in the impact of absences on SEL by grade level. As shown in Figure 7, all constructs are negatively affected by absenteeism. However, middle school is the level at which extended absence from school has the strongest negative impact on social-emotional development, with SE and SA having the steepest slopes. At the elementary level, the most affected constructs are SE and SM. At the high school level, the most affected construct is SA. Generally speaking, elementary and middle school are the levels during which extended absence from school has the strongest negative impact on social-emotional development. This is important because recent work using Project CORE data suggests that when social-emotional learning outcomes improve, so do test scores and behavioral outcomes—this is true across student subgroups and regardless of the baseline level of social-emotional learning.
Figure 7. Predicted Effects of Days Absent on SEL Outcomes, by School Grade Level
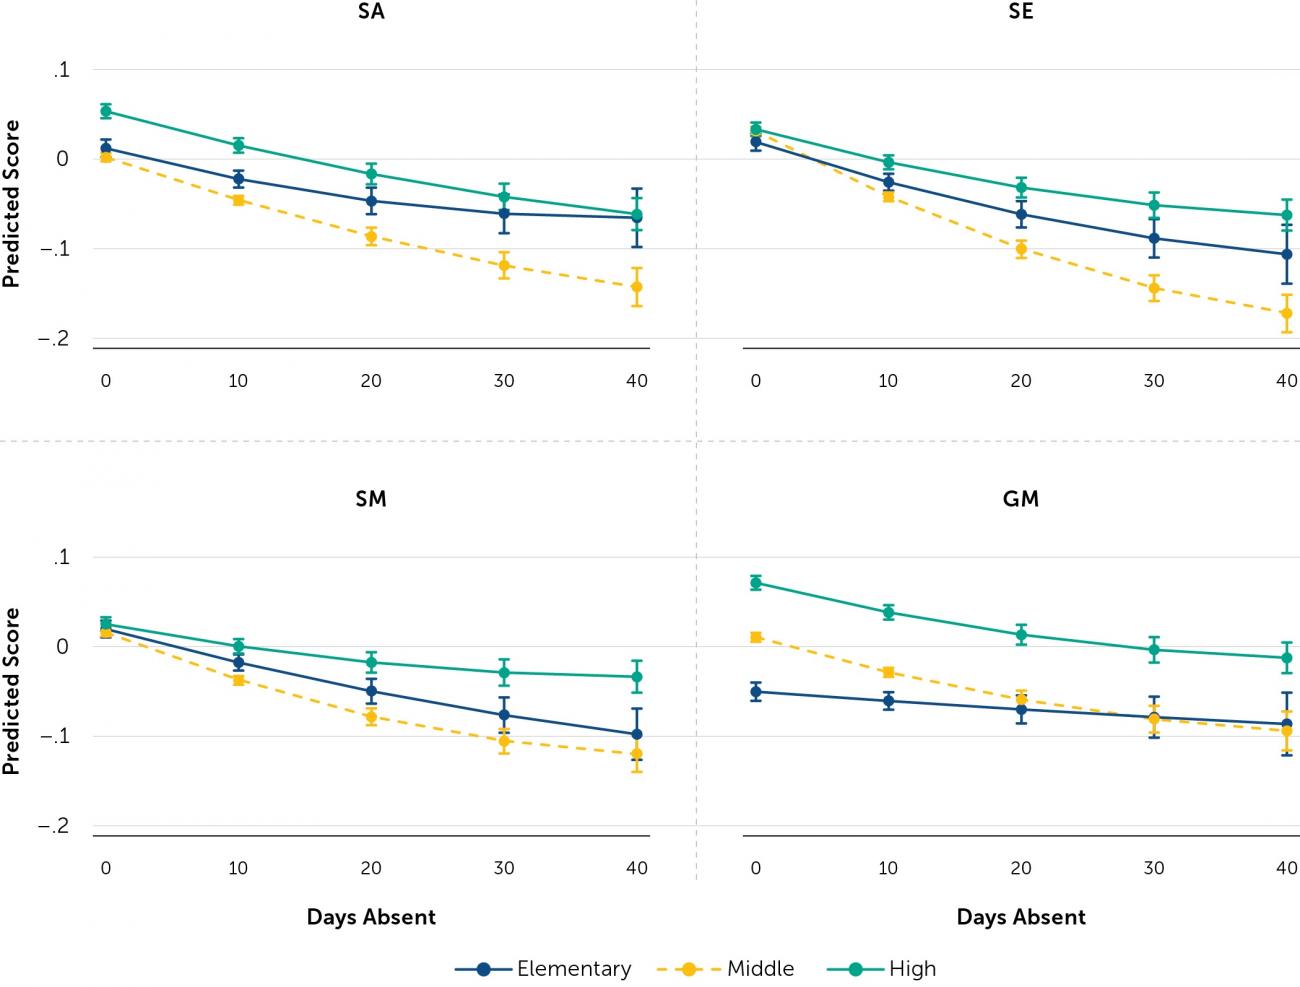
Note. Graph points represent the predicted probability on the outcome (construct score) for a given value of days absent (0, 10, 20, etc.). Data are for students in four CORE districts. Elementary grades include Grades 4–5; middle grades include Grades 6–8, and high school grades include Grades 9–12. Confidence intervals of 95 percent around the prediction mean estimate.
Conclusion
This study, using data from six large CORE school districts in California, shows that average absenteeism is low during the regular school year: about 7 days on average, although this is higher in secondary school and for certain subgroups such as HL/FST and SWDs. There is reason to believe that a significant number of students were absent from virtual schooling opportunities for extended and longer-than-normal periods during the COVID-19 pandemic. Our results suggest that if students missed more than a few weeks of cumulative instruction during the pandemic—which is likely, particularly among low-income and other disadvantaged students—their test scores and SEL outcomes are likely to be badly affected. Moreover, school closures and remote-only instruction continue through fall 2020 in most districts, and it is not yet clear whether adaptations to online learning as a result of the experience of this past spring will yield significantly greater engagement with instruction. These negative impacts are likely to hit students particularly hard in middle school and in mathematics. For SEL, the negative impact on elementary and middle schoolers of extended absences is significant. Moreover, students in certain subgroups, such as low-income students and SWDs, are likely to be the most affected. This study adds to the growing evidence on the potentially negative impact of COVID-19 on student development and the pandemic’s possible differential impacts by student subgroups and grade-level. Although COVID-19 presents unique circumstances, the evidence based on past experience suggests that many students will need intense academic and social-emotional support to make up for lost time.
Endnotes can be found in the full policy brief here.
Santibañez, L., & Guarino, C. (2020, October). The effects of absenteeism on academic and social-emotional outcomes: Lessons for COVID-19 [Policy brief]. Policy Analysis for California Education. https://edpolicyinca.org/publications/effects-absenteeism-academic-and-social-emotional-outcomes