12th-Grade Math


Summary
Academic preparation for postsecondary schooling is largely a function of rigorous, inclusive, and relevant high school curricula, including mathematics. Yet not all high school students have equal access to the courses that best prepare them for college and career. This infographic updates prior research1 with an additional year of course-taking data and extends descriptive analyses by exploring the math courses that students take prior to 12th grade and the performance of students in 12th-grade math courses. The descriptions provided here contribute to the evidence about troubling disparities in access to and success in advanced math courses and help inform efforts to increase and diversify high school math pathways. There is a related report on innovating high school math along with relevant case studies.
Policy Context
At present, California high school students must complete only two years of math to graduate from high school.2 However, the California State University (CSU) and University of California (UC) systems require three years (and recommend four years) of high school mathematics, including geometry and advanced algebra, for admission.3 Recently, CSU considered revising admission criteria to formally require students to complete an additional year of quantitative reasoning courses in high school. Although the proposal was not approved, it spurred efforts to increase math courses taken by high school seniors throughout the state. Expanding math course- taking is also one of the goals of the diversified math pathways included in the proposed revisions to the Mathematics Framework for California Public Schools: Kindergarten Through Grade 12, which is expected to be adopted by the State Board of Education in 2023.4
DatA and Methods
Statistics were calculated from student-level and course-level data in the California Longitudinal Pupil Achievement Data System (CALPADS). Enrollment in 12th-grade math is derived from CALPADS course data for students participating in the 11th-grade Smarter Balanced Assessments (SBAC) the prior year. These data are linked to student-level college enrollment data from the National Student Clearinghouse to explore the relationship between 12th-grade math course-taking and postsecondary enrollment. A–G course-approval data from the UC Office of the President supports the categorization of nearly 100 different math courses offered in high schools across the state. All figures include 12th graders in the 2018–19 academic year— the most recent cohort unaffected by the coronavirus pandemic—derived from participation in the 11th-grade SBAC in 2017–18. Statistics may vary from other reports due to sample differences and data limitations.
Just over 50 percent of all 12th-graders take an advanced math course, but 25 percent of them do not enroll in any math.
More than half of all seniors are enrolled in advanced math courses—including 12 percent in Calculus, 8 percent in AP Statistics, and 34 percent in other advanced math and statistics courses—providing an important foundation for success in college-level math. Eleven percent of seniors are enrolled in Algebra 2. About 17 percent of 12th graders are enrolled in courses preceding Algebra 2 in content and difficulty, and another 25 percent are not enrolled in any math courses, which means that more than 40 percent of high school graduates are unable to meet the 4 years of high school math, including Algebra 2, recommended for admission to the state’s 4-year universities.
Figure 1. 12th-Grade Math Course Enrollment, 2018–19
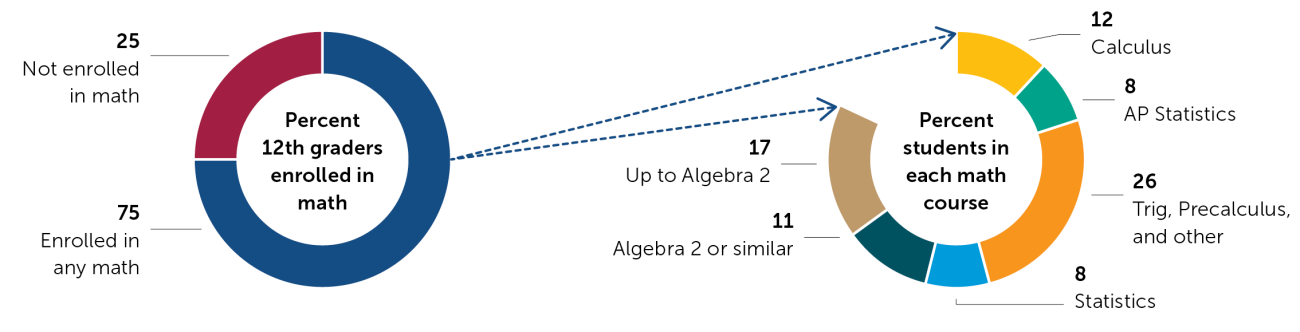
Note. Of the 75 percent of students enrolled in 12th-grade math, some take more than one math course.
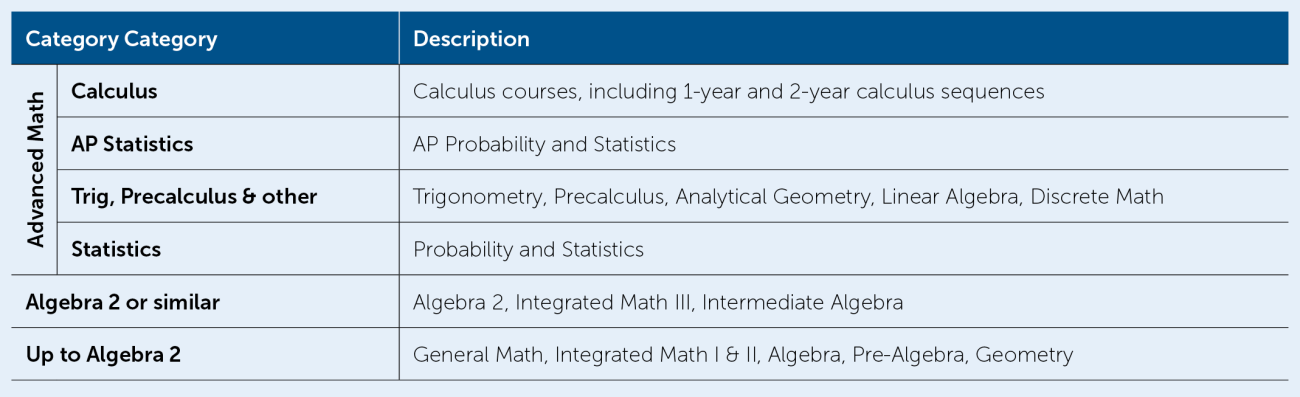
Categorizing Math Courses
California public schools offer nearly 100 different math courses. We grouped these courses into several succinct categories that reflect the content and difficulty of courses.
Table 1. High School Math Course Categories
12th-grade math course enrollment largely follows a predictable trajectory based on prior course-taking and academic achievement.
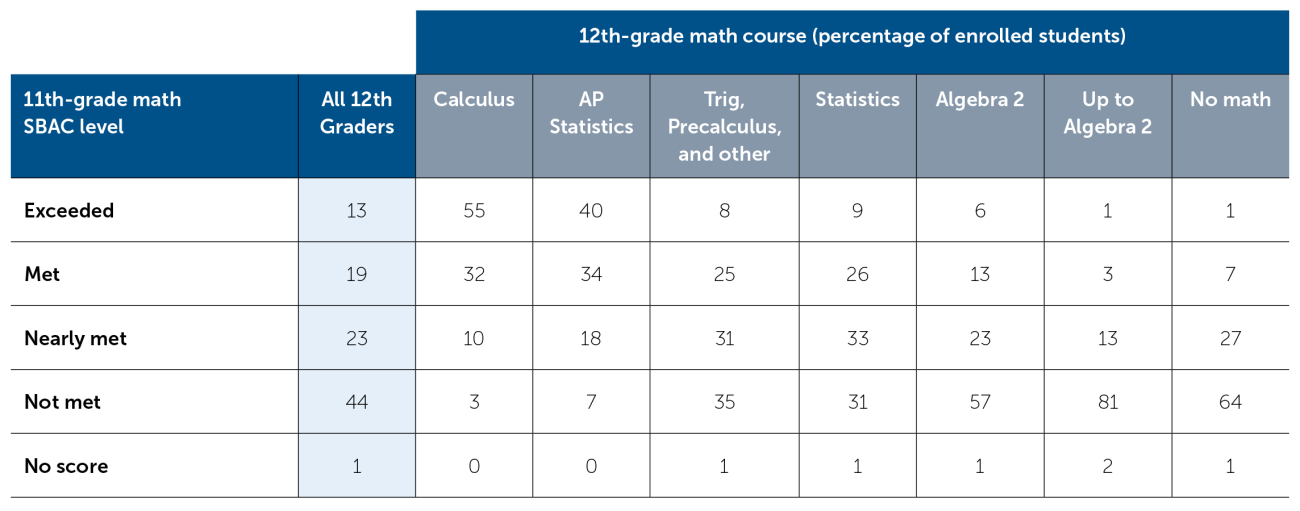
Most students who took advanced math in 12th grade also enrolled in an advanced math course in 11th grade and demonstrated stronger performance on the 11th-grade Smarter Balanced Assessment (SBAC) for math which may be attributed to both individual differences (i.e., abilities and interests) and systemic inequalities (i.e., access to quality math instruction and access to advanced courses in earlier grades). For example, 80 percent of seniors enrolled in Calculus completed an advanced math course the previous year, as did 67 percent of AP Statistics students. Similarly, 87 percent of students enrolled in Calculus and 74 percent of students enrolled in AP Statistics met or exceeded standards on the prior year SBAC, compared to only 19 percent of students taking Algebra 2 and 4 percent enrolled in courses preceding Algebra 2. Notably, of the 25 percent of seniors not enrolled in math, 79 percent took Algebra 2 or lower courses during 11th grade, and only 8 percent met or exceeded the 11th-grade SBAC standards. This indicates that lack of enrollment in math during 12th grade is not the result of “topping out” of the highest level math courses in 11th grade.
Table 2. Prior-Year Math Course Enrollment by 12th-Grade Math Course, 2018–19
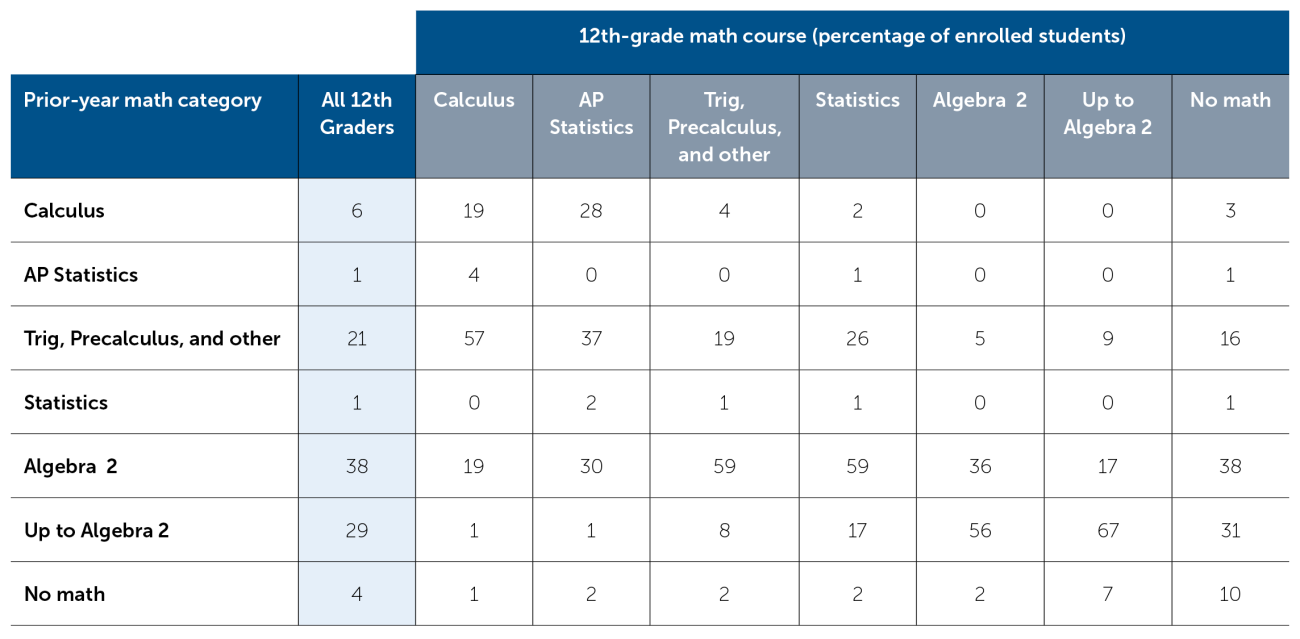
Table 3. Performance on 11th-Grade Math Assessment by 12th-Grade Math Course, 2018–19
Substantial disparities in 12th-grade math course-taking persist for students from different racial/ethnic and socioeconomic backgrounds.
Asian American and Pacific Islander students are substantially more likely to enroll in advanced math courses like Calculus and AP Statistics compared to their peers with different racial/ethnic backgrounds.Black students are the least likely to enroll in advanced math courses, and White students are the most likely to opt out of taking a math course during their senior year. Socioeconomically disadvantaged (SED) students are less likely to enroll in the most advanced math courses compared to non-SED students, and English learners (ELs) are twice as likely to enroll in courses preceding Algebra 2 in 12th grade as non-ELs. Collectively, these patterns suggest substantial disparities in opportunity across student subgroups stemming from a multitude of factors that include, but are not limited to, course availability, advising practices, and prior math performance.
Figure 2. Enrollment in 12th-Grade Math Courses by Key Student Subgroups, 2018–19
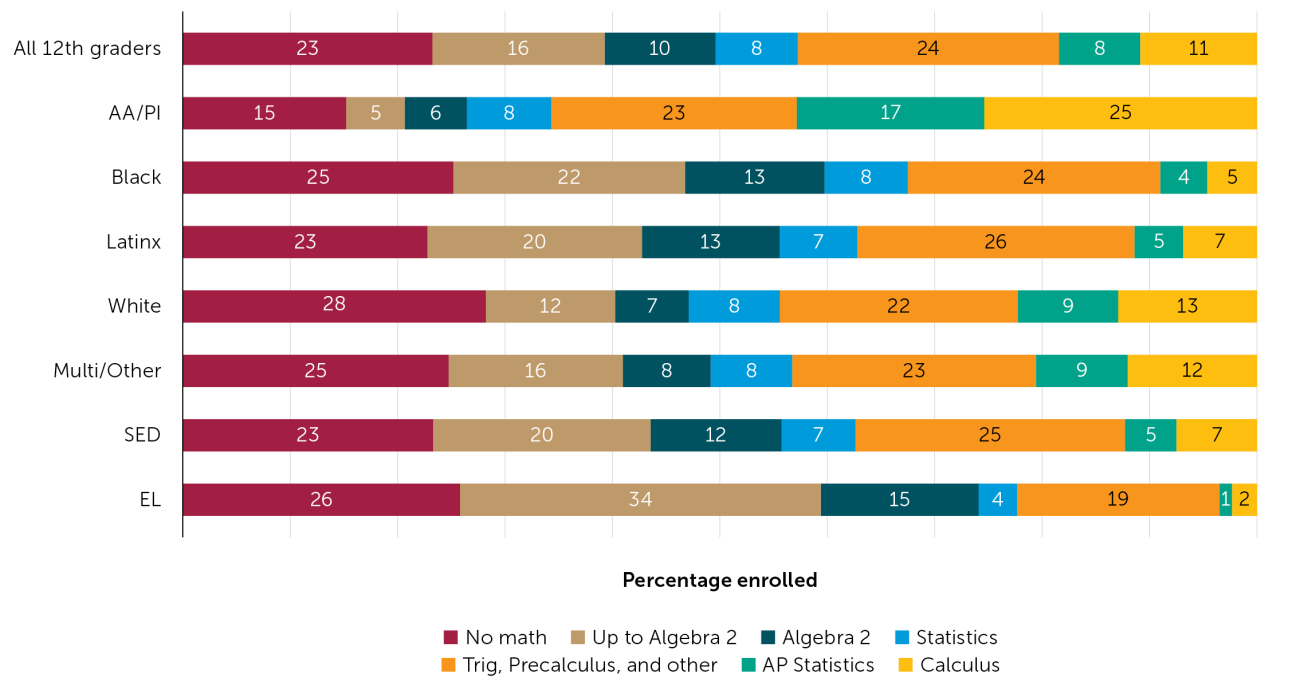
Note. AA/PI = Asian American and Pacific Islander. SED = socioeconomically disadvantaged. EL = English learner. Multi/Other includes students of Native American ancestry, students who identify with multiple racial/ethnic groups, and those for whom race/ethnicity information is missing. SED status is defined by the California Department of Education as either students who qualify for the free or reduced-price school meal program or students whose parents both did not graduate from high school. For our analysis, we used the student-level SED and EL identifiers in the 11th-grade SBAC data.
On average, students earn higher grades in more advanced math courses compared to those in less advanced math courses.
As might be expected, grades are higher overall in more advanced courses for all student subgroups. For example, grades in Algebra 2 and less advanced math are generally lower than in AP Statistics or Calculus. Just over half of students in Algebra 2 earn a C or higher, a necessary condition for admission to California 4-year public universities. We also find substantial performance differences across student subgroups within math course types, even among the most advanced math course categories. Across all math courses, Asian American/Pacific Islander and White students demonstrate the highest performance; Black and Latinx students as well as students identified as socioeconomically disadvantaged demonstrate the lowest performance. These troubling patterns demand much closer examination and attention in order to disrupt the systemic conditions that contribute to income and racial inequalities.
Figure 3. Distribution of Grades in 12th-Grade Math Courses by Key Student Subgroups, 2018–19
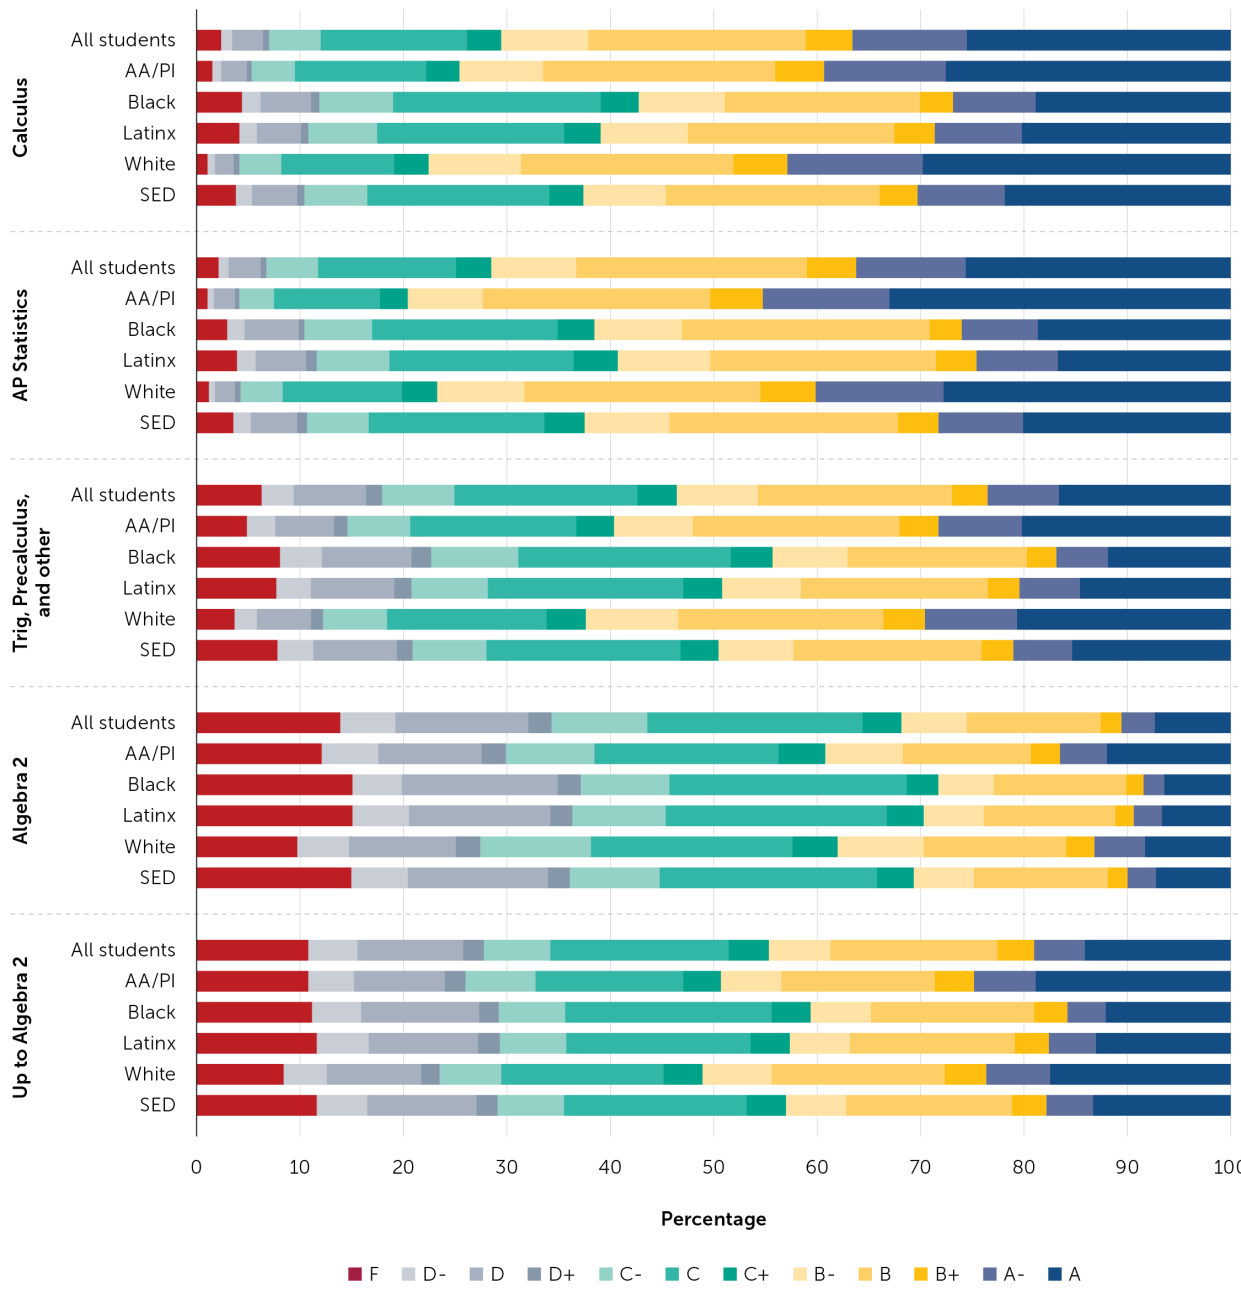
Note. AA/PI = Asian American and Pacific Islander. SED = socioeconomically disadvantaged.
Conclusions
In this report, we present updated statistics on math course-taking among California high school seniors. Consistent with our earlier report, we find that 25 percent of 12th graders do not enroll in any math course; slightly more than half of all seniors statewide enroll in advanced math courses; and another quarter enroll in classes up through Algebra 2. Moreover, we note substantial inequalities in senior-year math enrollment and performance by race/ethnicity and socioeconomic status. Given that a recent study of Los Angeles Unified School District high school graduates found that enrollment in a math course during 12th grade has a positive impact on college eligibility, enrollment, and persistence,5 this descriptive evidence raises deep concerns over uneven access to educational opportunities in math among California students. In addition to improving access to traditional advanced math courses for underserved students, there are important opportunities for school districts to adopt new courses that may better serve students whose postsecondary goals do not require Calculus.
Reed, S., Merritt, C., & Kurlaender, M. (2022, December). 12th-grade math: An updated look at high school math course-taking in California [Infographic]. Policy Analysis for California Education. https://edpolicyinca.org/publications/12th-grade-math
- 1Asim, M., Kurlaender, M., & Reed, S. (2019, August). 12th grade course-taking and the distribution of opportunity for college readiness in mathematics [Report]. Policy Analysis for California Education. edpolicyinca.org/publications/12th-grade-course-taking-and-distribution-opportunity-college-readiness-mathematics
- 2For a full list of California’s high school graduation requirements, see cde.ca.gov/ci/gs/hs/cefhsgradreq.asp. The state requires only two years of math for high school graduation, yet nearly two thirds of local education agencies increased the requirement to three or more years of high school math to graduate from their respective districts. See Gao, N., Lopes, L., & Lee, G. (2017, November). California’s high school graduation requirements [Fact sheet]. Public Policy Institute of California. ppic.org/wp-content/uploads/hs-graduation-requirements.pdf
- 3See admission requirements for UC at admission.universityofcalifornia.edu/admission-requirements/freshman-requirements and CSU at
calstate.edu/apply/freshman/getting_into_the_csu/pages/admission-requirements.aspx - 4For more information on the Mathematics Framework for California Public Schools, see cde.ca.gov/ci/ma/cf/mathfwrevtimeline2021.asp
- 5Wainstein, L, Miller, C., Phillips, M., Yamashiro, K., & Melguizo, T. (2023, January). Twelfth grade math and college access. Los Angeles Education Research Institute. laeri.luskin.ucla.edu/wp-content/uploads/sites/22/2022/12/LAERITwelfthGradeMathandCollegeAccessReport121522.pdf