Addressing Inequities in College Preparatory Course-Taking


Summary
Completing the A–G course sequence is the standard pathway to college for California high school graduates; however, findings indicate that there is substantial variation in A–G enrollment and completion rates across student subgroups and schools. This brief describes the distribution in access to and success in A–G courses as well as strategies that local leaders could consider to increase these rates among the students they serve. Drawing on the case studies of nine public school districts with exemplary A–G completion rates, we highlight best practices to broaden A–G access for students and ease barriers to completion. These practices include identifying gaps in availability and enrollment, implementing policies to expand equitable participation and completion, and monitoring A–G progress over time.
A related report by Sherrie Reed, Alexandria Hurtt, Michal Kurlaender, Justin Luu, and Cassandra Merritt (also available at right) provides the complete picture from which this brief emerges, finding that although overall participation in college preparatory coursework is increasing, disparities in course access and success by school, race/ethnicity, and socioeconomic status persist.
An appendix (also available at right) contains county- and district-level statistics for some of the statewide data points in the report.
A companion resource guide offers strategies, tools, and resources to improve access to and success in the A–G course sequence for all students as well as for key student subgroups. Drawing on interviews and data from nine school districts where the A–G course completion rate surpassed the statewide rate, author Patrick Lee highlights successful practices in three key areas: course alignment, counseling, and scheduling and placement.
Introduction
Academic preparation is a key factor in readiness for college-level work, 1 and students who engage in a rigorous course of study while in high school realize better secondary and postsecondary outcomes. 2 Evidence from recent research in California suggests that learning opportunities and outcomes are not equally distributed across the state, however. For example, only about 30 percent of students were deemed ready or conditionally ready for college-level work in mathematics and English language arts (ELA) based on results from the state’s 11th-grade standardized assessment in the years preceding the COVID-19 pandemic,3 and just 44 percent of 2019 public high school graduates were prepared for college and/or career based on results from the College/Career Indicator (CCI), 4 a critical component of the state’s accountability system. These rates of preparedness substantially varied by student subgroup and high school of attendance,5 prompting questions about the availability of and subsequent enrollment in college preparatory coursework across the state.
Key to this discussion are A–G courses, a set of 15 courses across seven subject areas that California high school students must complete successfully to be eligible for admission to the University of California (UC) and California State University (CSU) systems (see Figure 1 for a detailed list of the courses and subject areas). Every A–G course is approved by UC and CSU to meet rigorous standards of college preparatory work, reflecting a concerted effort to ensure that students are enrolled in courses that prepare them for the academic demands of college. The full sequence of A–G courses may not be available to all students, though—a potential roadblock on an otherwise customary pathway to college for California high schoolers. Recent legislation (Assembly Bill 130) allocated more than $547 million to local educational agencies (LEAs) to support them in increasing the number of students who graduate having successfully completed the full A–G course sequence and in attending to persistent disparities in A–G course access and completion.
Given the state’s large investment in improving A–G completion rates, along with efforts to increase college access more broadly, it is critical to examine A–G course-taking patterns and take stock of promising strategies to improve access to and success in such coursework. Leveraging both quantitative and qualitative research, this brief interweaves the findings from two complementary reports.6 The first describes inequities in A–G completion patterns across student subgroups and schools in California in the years prior to the pandemic—inequities that were most likely exacerbated in recent years. The second report explores emergent best practices gleaned from in-depth interviews with LEAs with above-average A–G completion rates that are experiencing improvement as they recover from the pandemic.
Figure 1. A–G Course Requirements by Subject
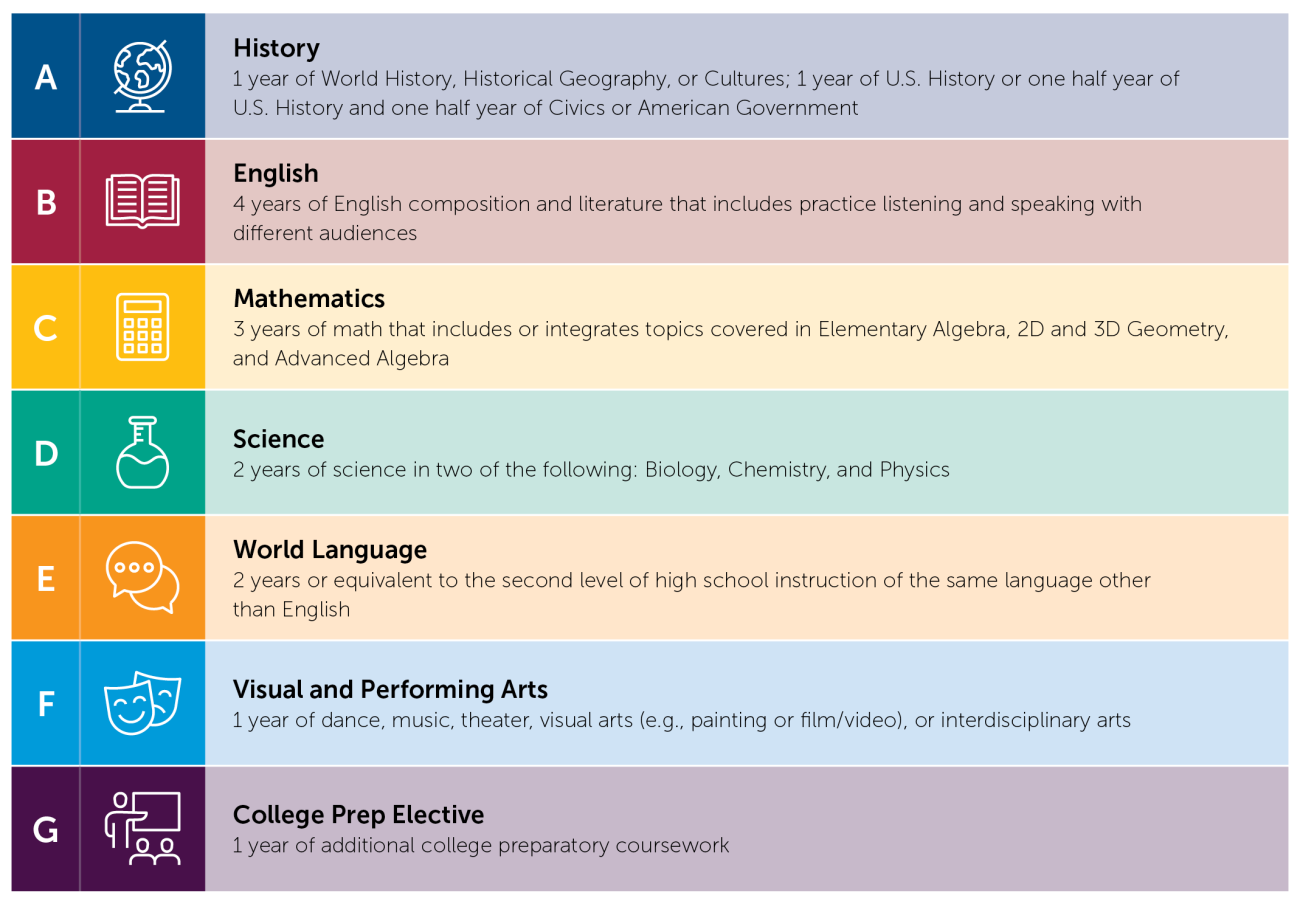
Note. Adapted from information from the University of California Office of the President.
Our Approach
To examine A–G completion rates and course-taking patterns, we drew on student-level data provided by the California Department of Education (CDE) for four recent graduating cohorts (2016, 2017, 2018, and 2019). These cohorts represent the breadth of data available at the time of analysis, including the most recent cohort that was unaffected by the pandemic.7 The data included individual indicators for A–G completion as well as demographic characteristics (e.g., race/ethnicity and socioeconomically disadvantaged status). We aggregated student-level observations to the school level to examine differences in course participation and success across schools, restricting our sample to traditional public schools with 15 or more students in a graduating cohort. To determine A–G course availability, we relied on the A–G Course Approval List maintained by the University of California Office of the President (UCOP) to construct A–G course counts by subject within a school.
We present rates of A–G completion statewide and by racial/ethnic subgroup.8 The descriptive differences we highlight in this brief are the result of multiple factors. For example, differences in A–G completion rates may be the result of both observable characteristics (e.g., course availability, socioeconomic status, and English proficiency) and unobservable student (e.g., motivation and effort) and institutional (e.g., advising and information availability) characteristics.
We augment this descriptive analysis with in-depth qualitative research that takes a closer look at the policies and practices at nine public school districts with exemplary A–G completion rates both overall and across key student subgroups. These districts are located in large metropolitan areas and represent the regional diversity of the state: three districts from Los Angeles County, two from the Bay Area, two from Riverside County, and one each from Sacramento County and Fresno County; all districts serve diverse student populations.9 We interviewed 30 district administrators, 23 school site leaders, 23 counselors, and 8 high school teachers, and we conducted document analysis of A–G policies, counseling materials, and student handbooks. Thematic analysis incorporated coding and analysis of interview transcripts and artifacts to identify common patterns related to alignment of A–G courses to graduation requirements and career technical education (CTE) pathways, counseling practices, A–G course scheduling, and student placement.
A–G Coursework in California: A Descriptive Analysis
Although completion of the A–G course sequence has been established as the expected traditional pathway to college for high school graduates statewide, findings indicate substantial variation in A–G completion rates across student subgroups and schools. The high schools that students attend play a critical role in their completion of the full A–G sequence. About 3 percent of high schools statewide do not offer any A–G-approved courses, and another 6 percent offer only some A–G courses. Even within schools with a full menu of A–G courses, students’ access to these courses and success in them may vary.
A–G Completion Rates Vary by Race/Ethnicity and These Gaps Persist Over Time
Statewide, nearly 50 percent of high school graduates completed the A–G course sequence.10 While overall completion rates have risen slightly between 2016 and 2019, sizable gaps in A–G completion between racial/ethnic subgroups have persisted from year to year (Figure 2). Asian American and Filipino students completed the A–G course sequence at consistently higher rates compared with students from other racial/ethnic subgroups—nearly twice that of Black, Latinx, and Pacific Islander students. For example, 72.4 percent of Asian American students completed A–G course requirements in 2019, compared with 36.9 percent of Black students.
Figure 2. A–G Completion Rates by Racial/Ethnic Subgroup, 2016–19 Cohorts
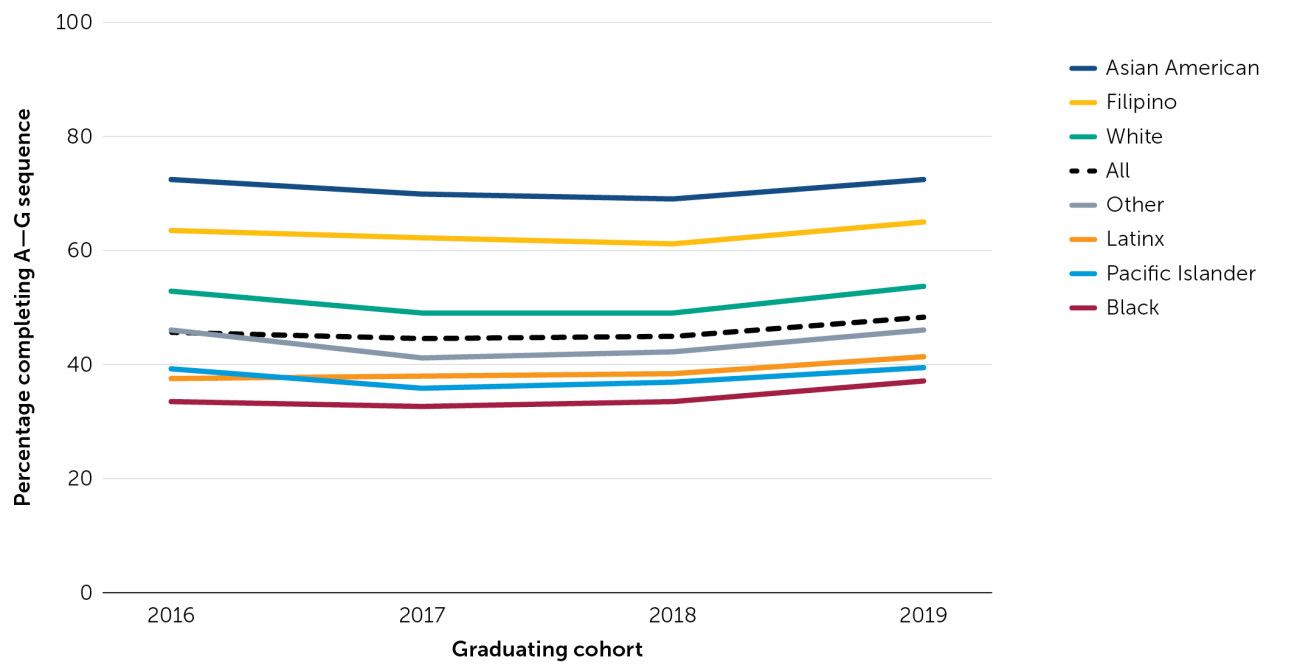
Note. A–G course completion rates were calculated from restricted-use student-level data in the College/Career Readiness Indicator data set provided by the California Department of Education. Analysis excludes students attending schools with School Ownership Codes other than 65, 66, or 67 and schools with fewer than 15 students in a graduating cohort.
A–G Completion Rates Substantially Differ by High School of Attendance
Differences also emerged at the school level, as the percentage of students who met A–G eligibility varied depending on where a student was enrolled (Figure 3). At four high schools, every graduate completed the full A–G course sequence in 2019, and at 125 schools, more than 90 percent of graduates completed A–G requirements. Conversely, at 174 schools—the majority of which were charter schools—no graduates completed the full A–G course sequence. Schools at either end of the spectrum—those with very high and those with very low completion rates—were more likely to be charter schools and smaller, on average, than schools with A–G completion rates between 40 and 80 percent.
Figure 3. A–G Course Completion Rates by High School (N = 1,500), 2019 Cohort
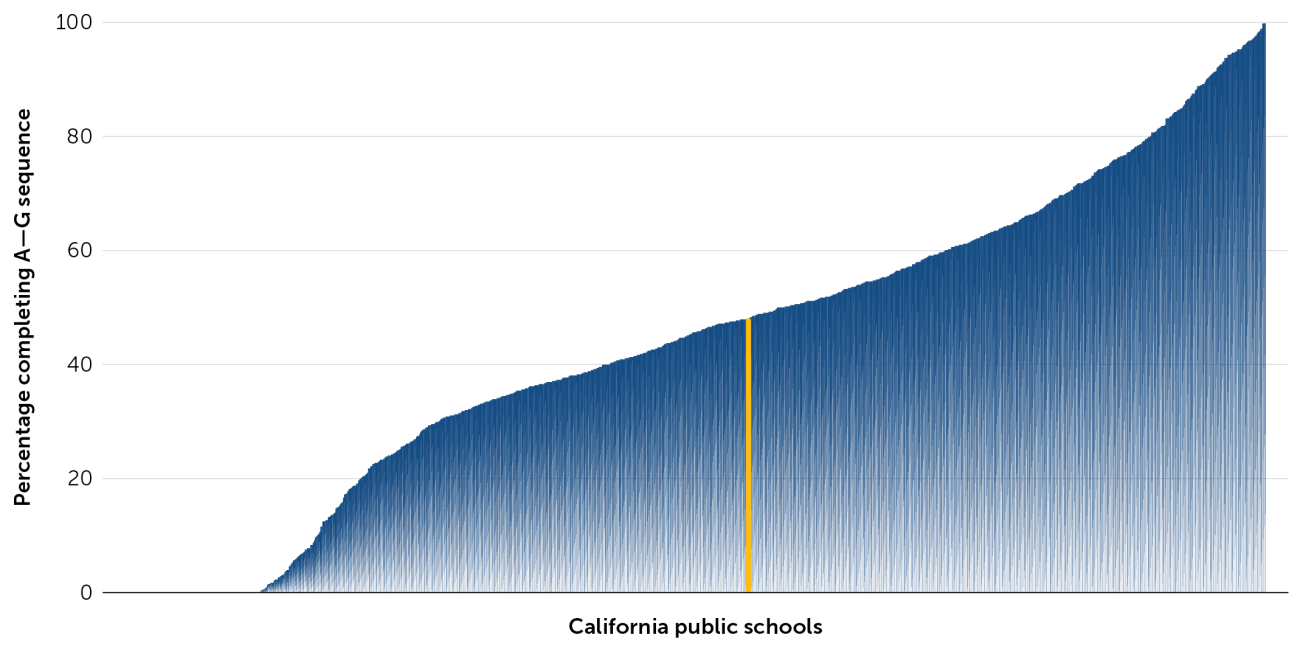
Note. Each blue bar represents a single high school in California. The yellow bar indicates the statewide A–G completion rate. A–G course completion rates were calculated from restricted-use student-level data in the College/Career Readiness Indicator data set provided by the California Department of Education. Analysis excludes students attending schools with School Ownership Codes other than 65, 66, or 67 and schools with fewer than 15 students in a graduating cohort.
Access to the Full Sequence of A–G Coursework Varies by High School
One potential barrier to A–G completion may be the availability of approved courses. Our analysis reveals that the majority of traditional and public charter high schools (91.4 percent) have the full sequence of A–G courses approved by UCOP, evidence that A–G courses in all subject areas may be available to students. Of the almost 10 percent of schools that did not have a sufficient number of approved courses to enable students to complete the full A–G sequence, most (84 percent) were charter schools.11
Performance in Math and Science Courses May Be a Roadblock to A–G Completion
Even when courses are available, successful completion of A–G requirements depends on performance, as eligibility for admissions to a UC or CSU college requires students to pass each course with a grade of C or better. Yet, as shown in Table 1, success in A–G courses is not experienced equally. Results reveal that, overall, students were less likely to pass A–G math and science courses compared with other disciplines. Moreover, students who were socioeconomically disadvantaged (62.8 percent), Black (58.5 percent), or Latinx (62.2 percent) passed math courses at disproportionately lower rates than their counterparts—a pattern that is consistent across all subjects.
Table 1. A–G Course Passing Rates by Academic Subject and Key Subgroup, 2019 Cohort
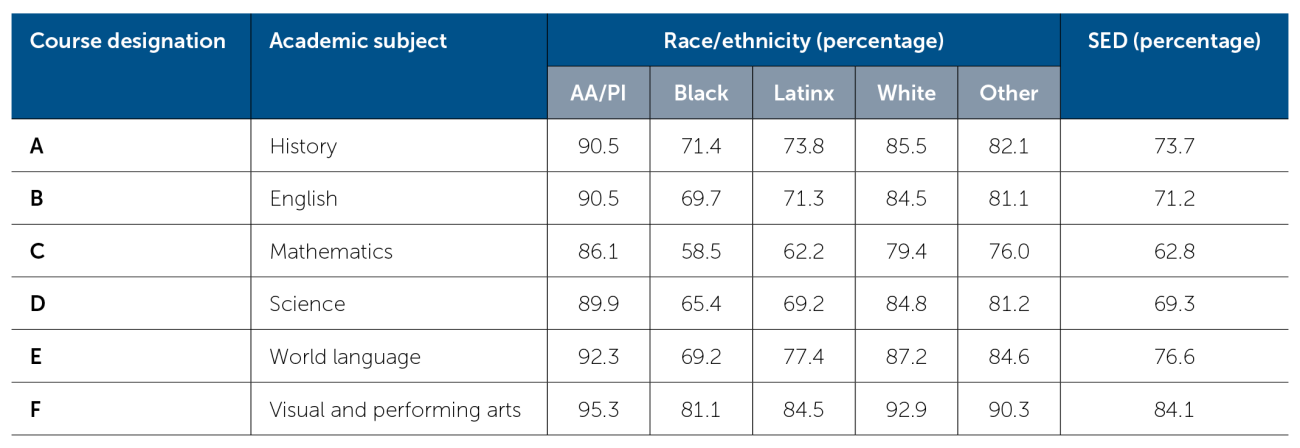
Note. AA/PI = Asian American/Pacific Islander; SED = socioeconomically disadvantaged. A–G course completion rates and demographic subgroups were calculated from student-level data in the College/Career Readiness Indicator data set. Performance in courses designated as “G” (i.e., an additional college preparatory elective in any A–F course) is included in the associated subject results. Passing rates were calculated by collapsing student- and course-level data in the California Longitudinal Pupil Achievement Data System (CALPADS).
Increasing A–G Enrollment and Completion: Strategies From Districts
While course availability and performance are key to successful completion of the A–G course requirements, institutional policies and practices may also introduce barriers or enhance support for student success. Drawing on case studies of nine school districts with above-average A–G completion rates, we offer examples of policies and practices that address the challenges surrounding A–G course availability, enrollment, and completion.
A–G Data Audits Help Identify Equity Gaps and Prompt Course-Level Changes
Across districts in this study, a data-driven approach was critical to identifying equity gaps in students’ access to and success in A–G courses. Most districts conducted comprehensive A–G audits every few years, if not annually, to determine patterns in A–G course enrollment and completion across schools and by student subgroups. These data were then used to inform changes in curricular offerings, including eliminating non-A–G courses, expanding the number of available A–G courses, revising existing courses to meet A–G approval, and/or aligning A–G course requirements with other programmatic offerings, such as CTE. For example, in San Francisco, students were able to complete 2 years of an integrated CTE pathway for graduation, with each CTE course also approved as an A–G course. Similarly, Val Verde offered 42 career pathways and ensured that every course within each pathway was also A–G approved. Routine data analysis helped inform school- and course-level changes to support students with meeting the A–G requirements fully.
Streamlined Processes Aid Course Development and Alignment
Any A–G course offered by a high school must first be approved by UCOP through its A–G Course Management Portal (CMP). Because obtaining course approval can take time, delays in submitting new (or revised) courses affect what schools can ultimately offer in their master schedules. District officials noted that developing new courses and/or revising existing courses to meet A–G approval criteria could take several years. Participant districts therefore streamlined course development; for example, Oakland created a course-development template that corresponds with the UCOP CMP submission areas—including curriculum units, assessments, and materials—to support the design of new A–G courses.
Along with efforts to streamline course development, districts monitored the alignment of A–G course titles, course codes, and offering statuses across schools, student information systems, and CMP to ensure that students received accurate credit for their A–G courses. To support this, Val Verde’s CMP account was centrally managed at the district level, with the district’s secondary coordinator implementing standard processes to create and modify A–G courses with consistency across schools.
Personalized Advising Practices Ease Uncertainties About A–G and Bolster Completion
In addition to course availability, course enrollment is an important component of A–G completion, but knowing which courses to take and when to complete the A–G course requirements may be a challenge for students. To ease this challenge, districts communicated with students and families about A–G requirements early and often, building college and A–G awareness in elementary and middle school and amplifying this effort with ongoing comprehensive advising activities to support postsecondary planning. In Nuview Union, for example, intensive A–G advising began in middle school during the high school summer bridge program. In Arcadia, high school counselors used Naviance (a comprehensive college- and career-planning program) to help students build 4-year course plans, identify the classes they should prioritize, and explore careers.
Counselors were credited as critical to guiding students through the A–G course sequence. Many participant districts employed personalized advising practices, which fostered trust and built relationships with students. For example, counselors in Natomas regularly met with students and parents, particularly during the college-planning process, while counselors in Covina-Valley continued to advise and support students even after they enrolled in college. Moreover, districts like Sanger designed counseling practices to support students more equitably—for example, by providing A–G information in multiple languages and collaborating with case managers and teachers.
Open Access and Purposeful Scheduling Counter Unintended Barriers to A–G Enrollment
Even when districts can expand the number of A–G courses offered across schools, placement and scheduling policies may create unintentional barriers to enrollment, particularly for historically marginalized students. One strategy that some districts implemented was open access to courses—including A–G, Honors, and AP—which eliminated potential constraints to course-taking. For example, in Covina-Valley no prerequisite classes, assessments, or essays were required for students to enroll in an advanced course. Districts also described scheduling practices to ensure equitable access for students, including prioritizing courses that support English learners or students with disabilities to prevent potential conflicts with A–G classes and enacting flexible course schedules (e.g., alternating block schedules) to increase course options for students.
Credit-Recovery Opportunities Built Into the School Day Support A–G Completion
As students must earn at least a C grade to be considered successful in an A–G course, course performance is critical. Additional supports, such as viable credit-recovery programs, are needed for those who may not pass a course in their first attempt. Participant districts reported greater student success in programs that built credit recovery into the school day or combined asynchronous learning with teacher-led supports. Districts implemented credit-recovery programs that incorporated options for students in terms of scheduling, instructional method, and the availability of learning supports. For example, Santa Fe High School and Pioneer High School in Whittier Union augmented the bell schedule with a rotating block of 20 minutes to support students not on track to pass their A–G courses. Fremont High School in Oakland developed a mastery-based credit-recovery model that allowed students to earn a 10 percent grade increase after completing a 6-week program that was embedded within the school day. Other schools (such as Sanger High School) employed online credit-recovery programs like Edgenuity, giving students the opportunity to complete assignments asynchronously.
Conclusion
Research indicates great variation in both A–G enrollment and completion across California’s high school student subgroups and the schools that serve them. Therefore, education leaders throughout the state should consider the following practices in their efforts to broaden access to college through the A–G course sequence.
- Diagnose gaps in A–G options and enrollment across students and schools. At the local level, district and school leaders could implement annual data audits to determine availability of and enrollment in A–G courses. These audits can help leaders identify misalignment between A–G requirements and programming as well as courses that may serve as gatekeepers to A–G completion. If course-level changes are needed, districts could consider revising, adopting, or designing courses to increase A–G course availability, which could include partnering across schools or with community colleges, or offering virtual learning options.
- Ensure equitable access to A–G courses. In addition to A–G course availability, districts and schools must be attentive to the accessibility of courses to ensure that enrollment opportunities are shared equitably among students. This can be accomplished through intentionality in schedule building, attending to counseling practices, limiting—or altogether removing—prerequisites for A–G and other college preparatory courses, and providing structures to support students’ academic success, such as preparation in earlier grades, tutoring, and equitable grading practices.
- Monitor A–G access, participation, and attainment over time. To sustain increased access to, enrollment in, and completion of A–G courses, efforts must be accompanied by systems to monitor progress across students and schools. Because monitoring A–G progress is important to students’ future course-taking and college plans, it may be valuable for education leaders to develop a tool (or tailor an existing one) that schools, students, and families can access easily and that is integrated into advising sessions.
Despite clear evidence of the benefits of advanced course-taking in high school, far too few high school graduates in California complete the A–G course requirements necessary for admission to the state’s 4-year public universities. Moreover, glaring disparities in course access and success by student race/ethnicity, socioeconomic status, and school of attendance persist. In fact, A–G courses are not equally available to all students, and even when sufficient courses are offered, students may struggle to access and complete them. Data from districts that have shown progress in increasing A–G completion rates across student subgroups suggest that intentional efforts at the local level can improve access and ease barriers to completion. These practices include identifying demographic gaps in A–G access and enrollment, implementing policies to expand equitable A–G participation and completion, and monitoring students’ A–G progress over time. School districts exploring ways to advance their own college-readiness initiatives could consider these strategies to expand A–G options, particularly as the A–G course sequence remains a prominent pathway to college for students across California.
Hurtt, A., Reed, S., Lee, P., & Kurlaender, M. (2023, July). Addressing inequities in college preparatory course-taking [Policy brief]. Policy Analysis for California Education. https://edpolicyinca.org/publications/addressing-inequities-college-preparatory-course-taking
- 1Bettinger, E. P., Boatman, A., & Long, B. T. (2013). Student supports: Developmental education and other academic programs. The Future of Children, 23(1), 93–115. jstor.org/stable/23409490; Kurlaender, M., & Howell, J. S. (2012). Collegiate remediation: A review of the causes and consequences [Literature brief]. College Board Advocacy & Policy Center. files.eric.ed.gov/fulltext/ED562687.pdf
- 2Adelman, C. (2006). The toolbox revisited: Paths to degree completion from high school through college. U.S. Department of Education. files.eric.ed.gov/fulltext/ED490195.pdf; Attewell, P., & Domina, T. (2008). Raising the bar: Curricular intensity and academic performance. Educational Evaluation and Policy Analysis, 30(1), 51–71. doi.org/10.3102/0162373707313409; Long, M. C., Conger, D., & Iatarola, P. (2012). Effects of high school course-taking on secondary and postsecondary success. American Educational Research Journal, 49(2), 285–322. doi.org/10.3102/0002831211431952; Woods, C. S., Park, T., Hu, S., & Betrand Jones, T. (2018). How high school coursework predicts introductory college-level course success. Community College Review, 46(2), 176–196. doi.org/10.1177/0091552118759419
- 3Kurlaender, M., Reed, S., Cohen, K., & Ballis, B. (2018). Getting down to facts II: College readiness in the era of Common Core [Technical report]. Policy Analysis for California Education. gettingdowntofacts.com/publications/college-readiness-era-common-core
- 4Rate as reported in the 2019 California School Dashboard. The CCI, part of the California School Dashboard, includes three performance levels: prepared, approaching prepared, and not prepared. Performance is determined at the school level based on the proportion of students prepared for college and career and is a composite measure that includes A–G course completion, among other criteria.
- 5Kurlaender et al., 2018; Reed, S., Kurlaender, M., & Carrell, S. (2019). Strengthening the road to college: California’s college readiness standards and lessons from district leaders [Report]. Policy Analysis for California Education. edpolicyinca.org/ publications/strengthening-road-college
- 6Reed, S., Hurtt, A., Kurlaender, M., Luu, J., & Merritt, C. (2023, June). Inequality in academic preparation for college [Report]. Policy Analysis for California Education. edpolicyinca.org/publications/addressing-inequities-college-preparatory-course-taking; Lee, P. (2023, June). A–G resource guide: Insights and strategies from exemplar school districts [Report]. Policy Analysis for California Education. edpolicyinca.org/publications/a-g-resource-guide
- 7Although data for the 2020 graduating cohort are available, A–G completion rates may differ from prior years and reflect altogether different societal conditions because of the COVID-19 pandemic.
- 8We report rates for seven racial/ethnic subgroups: Asian American, Black, Filipino, Latinx, Pacific Islander, Other, and White. The Other category includes Native Americans, multiracial students, and students for whom race was not reported in CDE data. For detailed information about other key subgroups, please see Hurtt et al., 2023.
- 9For additional information about the districts selected for qualitative analysis, please see Lee, 2023.
- 10A–G completion rates may differ in other published works because of sample restrictions and/or cohort composition. For example, CDE’s DataQuest reports lower rates of overall A–G completion as its analysis includes every high school graduate.
- 11See Figure 8 in Hurtt et al., 2023, for more detail.