Career Technical Education Among California High School Graduates


Summary
Career Technical Education (CTE)—a structured series of courses that provides high school students technical and vocational skills, paving the way to postsecondary education and careers—is key to aligning secondary education with both labor market needs and college opportunities.
CTE provides high school students with the chance to engage in practical learning experiences, boosting engagement and expanding students’ exposure to and preparation for a variety of careers. CTE participation is linked to increased high school graduation rates,1 greater likelihood of enrollment in two-year colleges,2 and higher earnings.3 With the promise of improved student outcomes, California has invested substantially in CTE over the last ten years (See “Recent Policy and Funding Efforts to Improve Career Education” section below). While CTE is generally linked to better educational and earnings outcomes, these outcomes vary across student subgroups4 and industry sectors.5
CTE in California’s high schools is organized around 15 industry sectors, such as Agriculture & Natural Resources; Health Science & Medical Technology; and Manufacturing & Product Development (see page 5 for a complete list of industry sectors). Within each industry sector, there are a number of pathways—a sequence of two or three courses with a final capstone course—that a student may choose to complete. For instance, the Agricultural Business, Agriscience, Animal Science, Ornamental Horticulture, Plant, and Social Science pathways all fall under the Agriculture & Natural Resources industry sector. In 2021–22, there were 57 pathways among the 15 industry sectors. To complete a CTE pathway, a student must earn a grade of C− or better in the pathway’s capstone course.
Participation in specific CTE pathways is a function of many factors beyond student choice, including but not limited to course availability and scheduling within a high school or at an alternative school site,6 distance from the student’s high school to the CTE program,7 and partnerships between high schools and local businesses. As such, pathways are not equally available to students across schools.
This infographic provides an updated look at CTE pathway completion among California public high school graduates8 and at how completion patterns vary by student race/ethnicity, gender, and CTE industry sector.
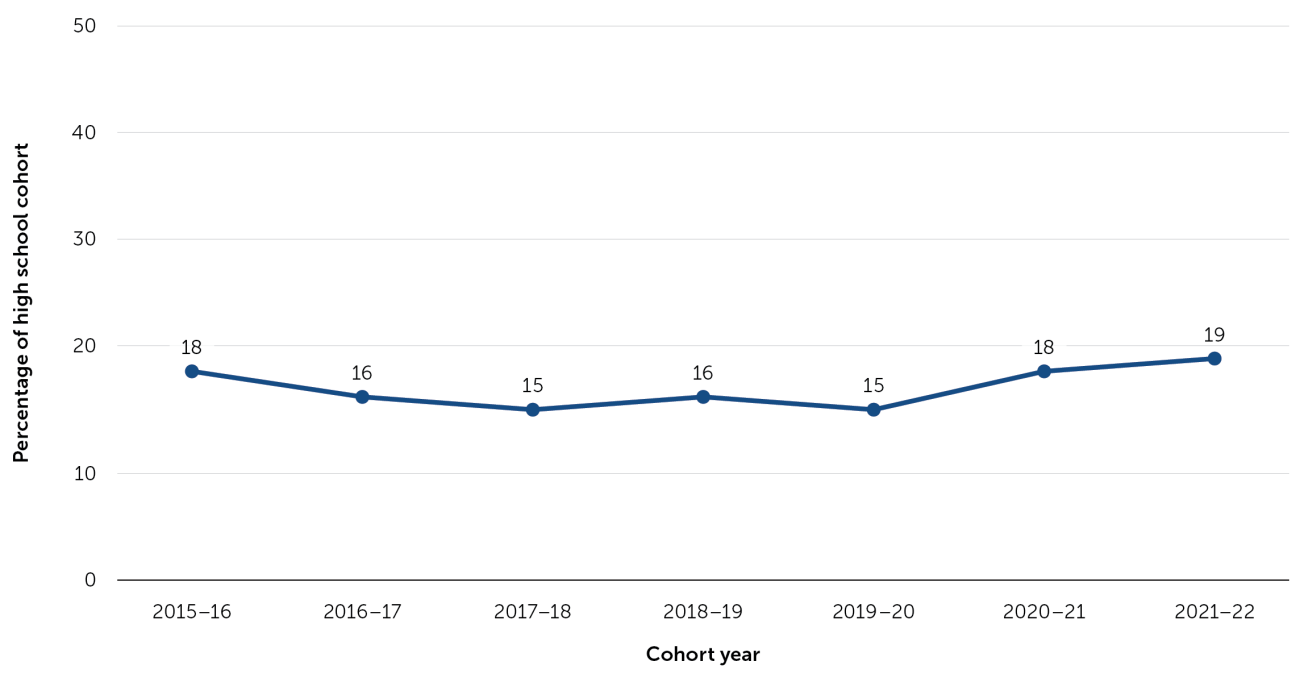
CTE pathway completion has been stable over time. As shown in Figure 1, about one fifth of California public high school graduates in the last seven cohorts completed at least one CTE pathway prior to graduation.
Figure 1. CTE Pathway Completion for High School Graduates Over Time
Recent Policy and Funding Efforts to Improve Career Education
California’s Governor Newsom and the California Legislature have both emphasized the importance of Career Technical Education (CTE) through financial investment in CTE programs and the adoption of policies to streamline career-focused education at the secondary and postsecondary levels.
In 2021–22, California spent $300 million for high school career and technical education through the CTE Incentive Grants (CTEIG) program and an additional $150 million through the Strong Workforce Program (SWP). Investments in these two programs recur annually—CTEIG funding has ranged from $150 million to $400 million annually since it was implemented in 2015–16, and SWP funding has been $150 million annually since 2018–19.
In 2022, the California Legislature also allocated $500 million—through the Golden State Pathways Program (GSPP)—for the creation and enhancement of career pathways in sectors that offer well-paid jobs, require advanced skills, and are experiencing significant growth.
Most recently, in 2023 Governor Newsom signed an executive order to create a new Master Plan on Career Education. The plan will coordinate and align career education investments to ensure all high school students explore “well-compensated, lasting careers”; experience “hands-on learning and real-life skills”; and access career education “that reduce[s] the burdens of substantial debt” and avoids “navigating confusing bureaucracies.”9
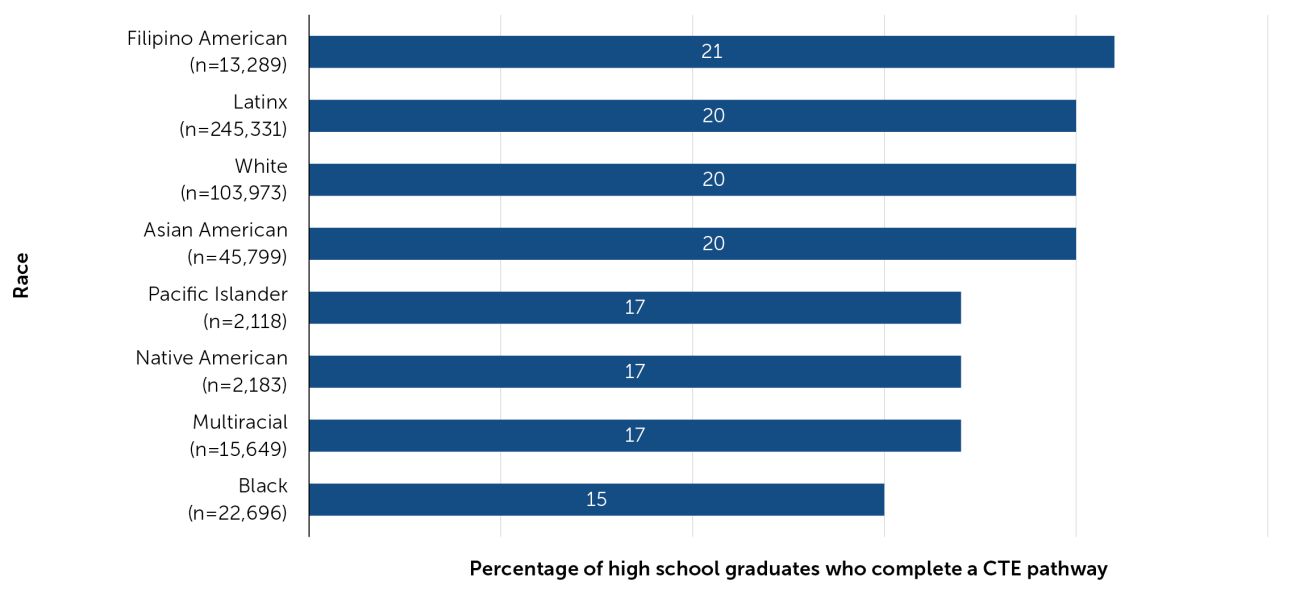
CTE pathway completion varies slightly across racial/ethnic subgroups with rates ranging from 15 percent to 21 percent. Figure 2 depicts CTE pathway completion rates for student racial/ethnic subgroups. Roughly 20 percent of Filipino American, Latinx, White, and Asian American students completed a CTE pathway in high school. By comparison, about 15 percent of Black students completed a pathway.
Figure 2. CTE Pathway Completion Across Student Racial/Ethnic Subgroups
Across gender identities as well as socioeconomic status, CTE pathway completion rates are similar. Figure 3 shows that approximately 19 percent of female students and 20 percent of male students completed a pathway. Similarly, 19 percent of socioeconomically disadvantaged (SED) students and 20 percent of not socioeconomically disadvantaged students completed any CTE pathway.
Figure 3. CTE Pathway Completion by by Gender and SED Status
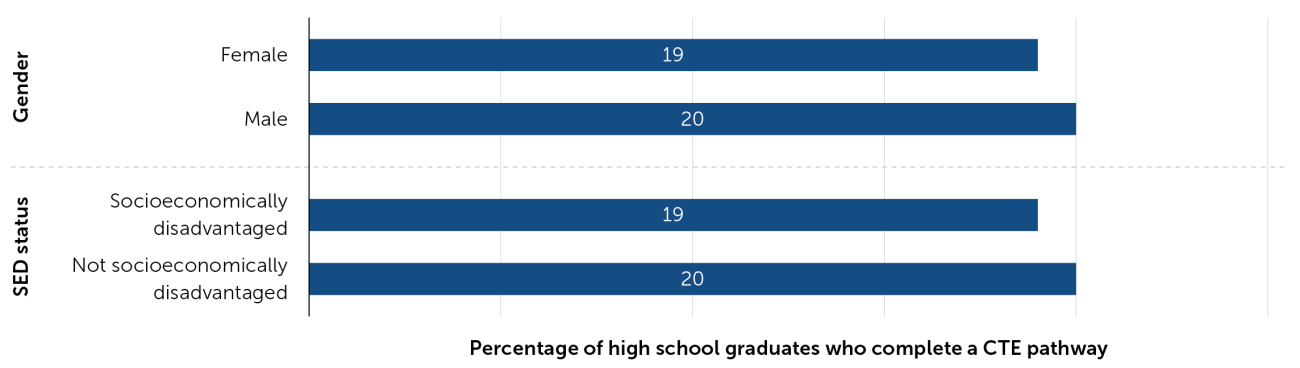
Note. Starting in 2019–20, California Department of Education included a gender category for nonbinary. We do not include these students in this visual due to the small population size (417 students, which is 0.09 percent of the 2021–22 cohort).
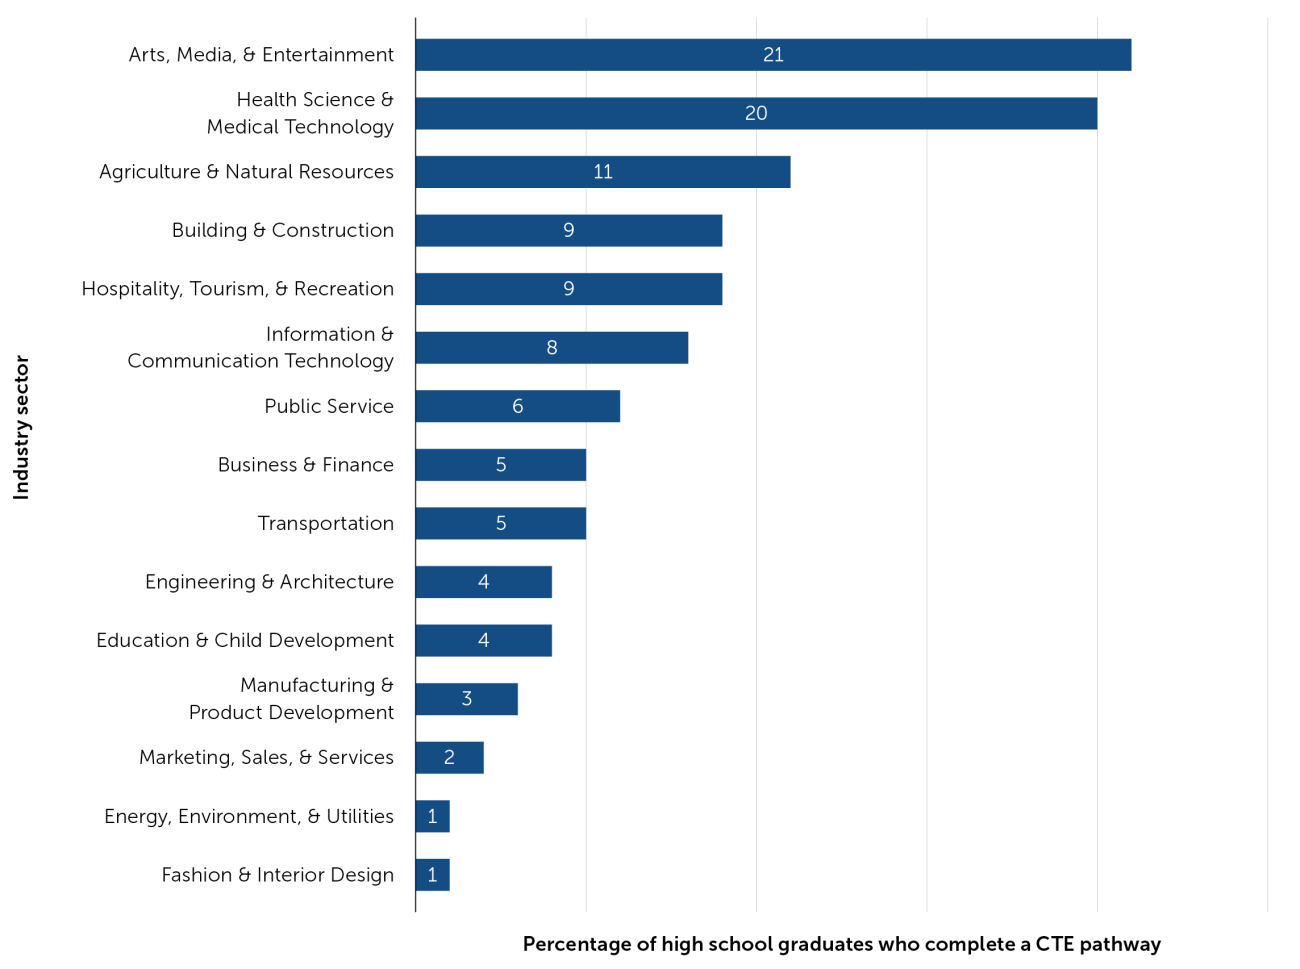
Participation varies substantially across CTE industry sectors. The two industries with the highest rates of participation across all CTE pathways in which students complete the capstone course are Art, Media, & Entertainment and Health Science & Medical Technology, with 21 percent and 20 percent respectively. In contrast, the Energy, Environment, & Utilities together with the Fashion & Interior Design industry sectors account for just one percent of all CTE pathway completers. Figure 4 shows the percentage of high school graduates completing a CTE pathway in each industry sector.
The Golden State Pathways Program (GSPP) aims to increase participation in industries for which there is critical need for skilled workers and in which there are currently lower rates of participation, including fields related to the environment, climate change, and education. Additionally, while fields related to technology and healthcare already have high rates of participation relative to other industry sectors, the GSPP aims to increase participation in these areas in order to meet the demands of the labor market.
Figure 4. CTE Pathway Completion by Industry Sector
While overall CTE pathway completion varies little by race, representation by race differs substantially across CTE industry sectors. Given the differences in postsecondary and labor market outcomes associated with different industries,10 it is important to examine the racial composition across CTE industries to ensure students have the information, agency, and opportunities to pursue fields that most interest students and that set them up for success. For example, the Health Science, the Education, and the Information Technology pathways are associated with a higher probability of attending college as well as higher earnings, whereas the Building & Construction as well as the Transportation pathways are associated with greater labor market outcomes but lower college attendance.11
Figure 5 illustrates the degree to which racial/ethnic subgroups are overrepresented or underrepresented in each industry. For example, Black students are vastly underrepresented (by 69 percent) in Agriculture & Natural Resources, where they represent only 1.6 percent of pathway completers compared to 5 percent of the graduating cohort. In contrast, Asian American students are overrepresented (by 178 percent) in Information & Communication Technology; they represent 28 percent of pathway completers and are 10.1 percent of the graduating cohort. If a group has perfect representation, their over- or underrepresentation point is on the zero percent line.
Figure 5. Representativeness of CTE Pathway Completion by Racial/Ethnic Subgroup Across Industry Sectors
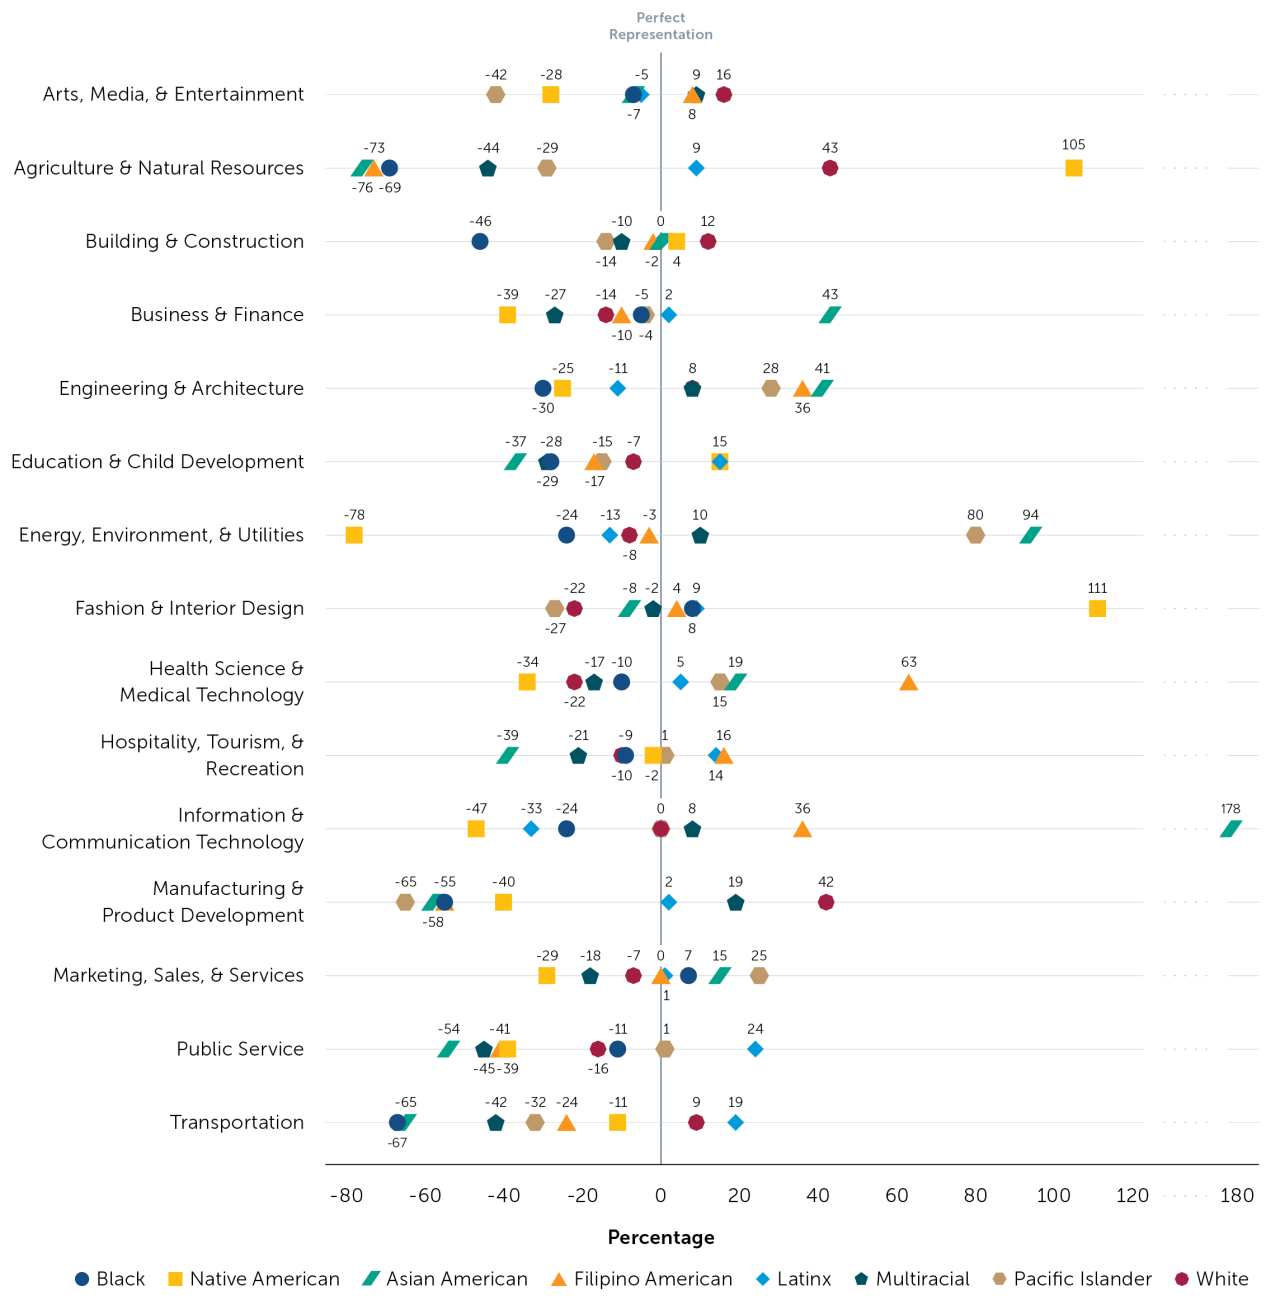
Note. Over- or underrepresentation is calculated by taking the percentage difference between the proportion of a group in the graduating cohort and the proportion of that group in an industry. For instance, Latinx students are 54 percent of the cohort and 54 percent of the Building & Construction industry. We calculate (0.54-0.54)/0.54 to find zero percent, or perfect representation.
Similarly, although there is virtually no difference in overall CTE participation by gender, there are notable differences in participation by gender across industry sectors. At one end of the spectrum, in the Transportation and the Building & Construction industries, 9 percent and 19 percent respectively of CTE pathway completers are female. At the other end of the spectrum, 85 percent and 84 percent respectively of the Fashion & Interior Design and the Education & Child Development industry participants are female.
Figure 6. Representativeness of CTE Pathway Completion by Gender Across Industry Sector
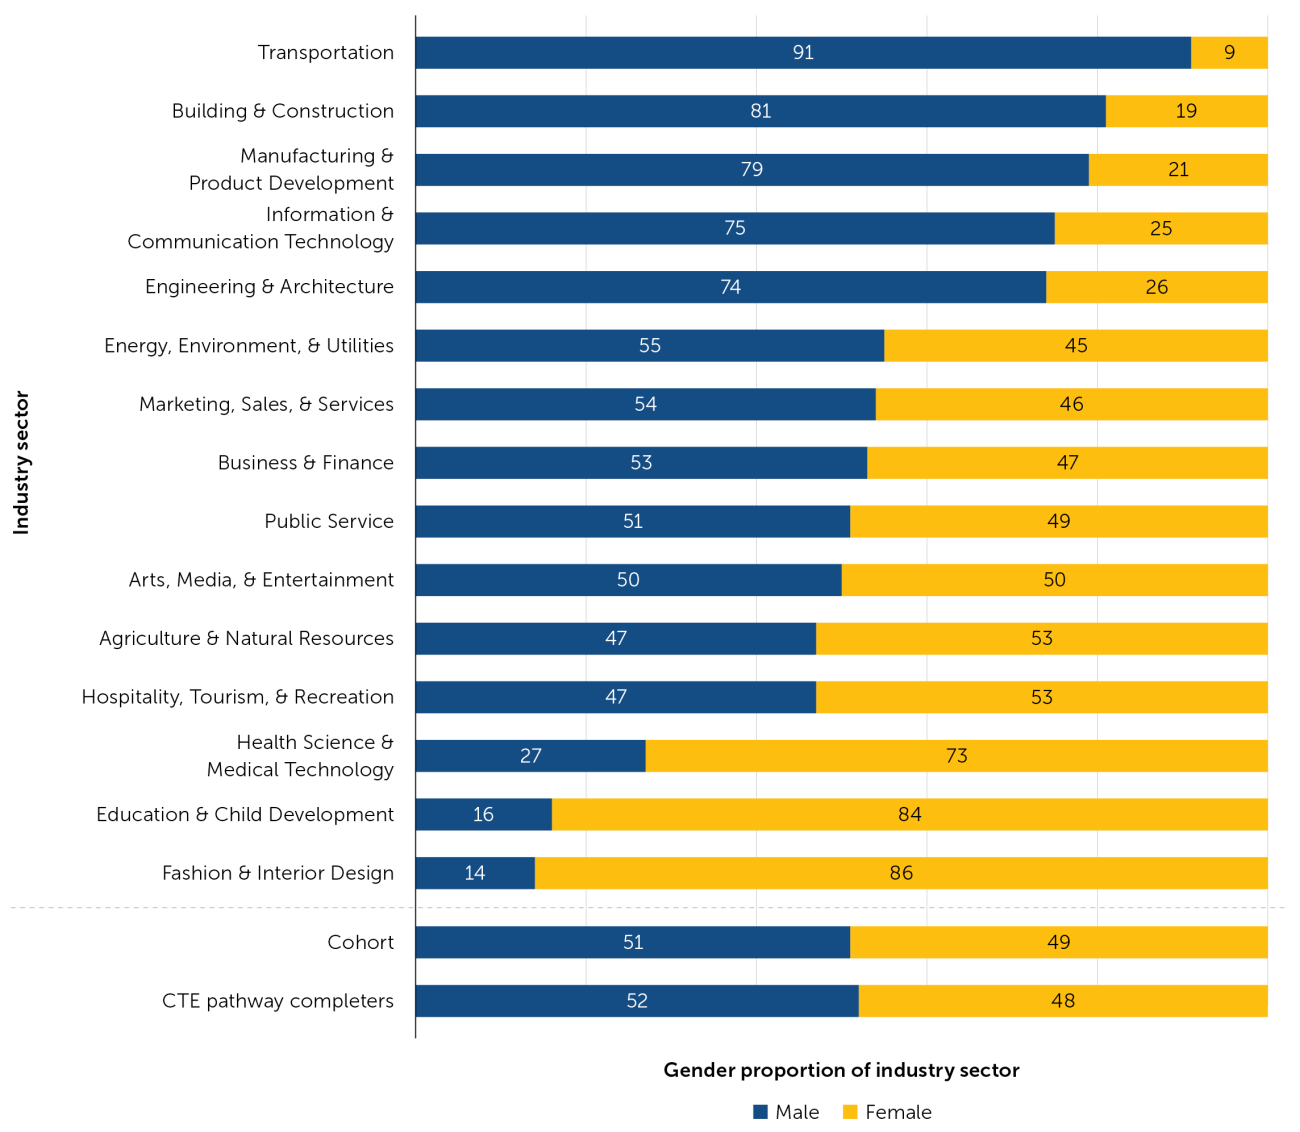
Note. Although we do not include nonbinary students in this figure due to the small sample size, the industries with the most nonbinary students are Fashion & Interior Design; Information & Communication Technology; and Arts, Media, & Entertainment.
Data and Methods
To examine Career Technical Education (CTE) pathway completion among California public high school graduates, we leveraged student-level data from the California Department of Education for graduating cohorts between 2015–16 and 2021–22. Specifically, we used data from the College and Career Indicator (CCI) to construct the cohorts of graduates and for the race/ethnicity and socioeconomically disadvantaged (SED) indicators; we used the California Longitudinal Pupil Achievement Data System (CALPADS) Cumulative Enrollment dataset for the gender variable. We used the CTE pathway completion data within the CCI and a separate CTE Pathway Completion data set to determine students’ CTE pathway completion. Aside from Figure 1, our sample includes 453,900 students from the 2021–22 graduating cohort. The single cohort is displayed for simplicity, though general patterns of CTE pathway completion—by race/ethnicity, gender, socioeconomic status, and across industry sectors—are consistent over time.
CTE courses taken through community colleges (i.e., CTE-focused dual enrollment) do not appear in this analysis. Future work will focus on CTE-focused dual enrollment.
The research reported here was supported by the Stuart Foundation; UC Office of the President, Multicampus Research Programs and Initiatives, through grant M21PR3278; and the Institute of Education Sciences, U.S. Department of Education, through Grant R305A210217 to the Regents of the University of California. The California Education Lab and PACE are grateful to the College Futures Foundation and the Bill and Melinda Gates Foundation for supporting dissemination, and to the California Department of Education for providing the data necessary for analysis. This infographic, like all PACE publications, has been thoroughly reviewed for factual accuracy and research integrity; the findings and conclusions are those of the authors alone and do not necessarily reflect positions or policies of the funders, including the U.S. Department of Education, or the agencies providing data.
Boochever, A., Reed, S., & Kurlaender, M. (2023, November). Career Technical Education among California high school graduates [Infographic]. Policy Analysis for California Education. https://edpolicyinca.org/publications/career-technical-education-among-california-high-school-graduates
- 1Dougherty, S. M. (2018). The effect of career and technical education on human capital accumulation: Causal evidence from Massachusetts. Education Finance and Policy, 13(2), 119–148. doi.org/10.1162/edfp_a_00224
- 2Dougherty, S. M., Gottfried, M. A., & Sublett, C. (2019). Does increasing career and technical education coursework in high school boost educational attainment and labor market outcomes? Journal of Education Finance, 44(4), 423–447.
- 3Dougherty et al., 2019.
- 4Brunner, E. J., Dougherty, S. M., & Ross, S. L. (2023). The effects of career and technical education: Evidence from the Connecticut technical high school system. The Review of Economics and Statistics, 105(4), 867–882. doi.org/10.1162/rest_a_01098
- 5Ecton, W. G., & Dougherty, S. M. (2022). Heterogeneity in high school career and technical education outcomes. Educational Evaluation and Policy Analysis, (45)1, 157–181. doi.org/10.3102/01623737221103842
- 6Jacob, B., & Ricks, M. (2023). Why choose career technical education? Disentangling student preferences from program availability. NBER Working Paper 31756. nber.org/papers/w31756
- 7Jacob & Ricks, 2023.
- 8Reed, S., Dougherty, S. M., Kurlaender, M., & Mathias, J. (2018). A portrait of California Career Technical Education pathway completers. Policy Analysis for California Education. gettingdowntofacts.com/publications/portrait-california-career-technical-education-pathway-completers
- 9Exec. Order No. N-11-23. (2023). gov.ca.gov/wp-content/uploads/2023/08/8.31.23-Career-Education-Executive-Order.pdf
- 10Ecton & Dougherty, 2022.
- 11Ecton & Dougherty, 2022.