The Transition to College

Summary
This brief examines the experiences of California high school seniors from the graduating class of 2023, offering insights into their preparation, plans, and concerns for college prior to enrollment. Drawing on results from a large-scale survey of seniors, the findings reveal important variation in students’ secondary school experiences and their plans for college, particularly by race/ethnicity and gender identity. As students’ experiences in high school influence concerns about their college futures, these results represent an important marker of what college going may look like for future graduating cohorts and can help policymakers and practitioners better understand the context of students’ postsecondary decisions and pathways.
Introduction
Nearly two thirds of California high school graduates started college in fall 2023.1 Their matriculation arrives on the heels of a unique schooling experience: This cohort of students spent a significant portion of their early high school career (ninth and tenth grades) learning remotely because of the COVID-19 pandemic, which disrupted the traditional high school experience. This cohort was also the first under a new mandate for all high school graduates to complete the Free Application for Federal Student Aid (FAFSA) or, for undocumented students, the California Dream Act Application (CADAA).
This brief summarizes findings from a survey distributed in May 2023, as students were transitioning out of high school. The aim of the survey was to understand high school seniors’ perspectives and attitudes about their postsecondary plans on the cusp of college matriculation. Examining the schooling experiences of the most recent graduating class of California high school seniors offers important insights into their perceived preparation and plans for college prior to enrollment as well as any trepidations they had.2 The results revealed that most students (nearly 63 percent) felt prepared for college, yet students expressed concerns about what to expect academically and financially (being able to cover tuition and living expenses), among other concerns. Across these domains, some differences emerged by student demographic subgroup, including race/ethnicity, gender identity, and parental education level.
About the Survey
In spring 2023, the California Education Lab at the University of California, Davis, partnered with the California Student Aid Commission to document the experiences of high school seniors. The web-based survey was sent to all seniors statewide who had submitted the FAFSA or CADAA for the 2023–24 academic year. This was the first year that high school students were required to submit a FAFSA/CADAA, so financial aid applicants may be more representative of the broader population of the graduating class than previous cohorts.
By responding to Likert scale survey questions, students reported on varying dimensions of their preparation and plans for the future. Additionally, in responses to open-ended questions, students described in their own words the challenges and excitement about college they anticipated prior to matriculation.
Here, we present data on the more than 10,000 survey respondents who indicated they were high school seniors. Seniors were asked about their college preparedness as well as their intent to enroll in college in fall 2023. Those who intended to enroll in college (approximately 9,200 seniors) were then asked about their college plans; these students compose our sample for this report. We also capture differences in student experience by self-reported race/ethnicity, gender identity, and parental education level. We focus on findings from the largest subgroups in each of these categories. This research follows our prior reports,3 which document the obstacles college students faced during the pandemic and the great uncertainty that high school students expressed about their college futures.
Although the survey response rate, at 4 percent, was considerably low, the large sample size (over 10,000 students) represents a diverse group of students from many different backgrounds and geographic regions throughout the state. Thus, although the results presented in this brief are not statistically generalizable to the broader population, they capture a critical slice of recent California high school graduates.
Sample Characteristics
Table 1 reports average demographic characteristics of our analytical sample by race/ethnicity,* gender identity,4 and level of parental education.5 Of survey respondents, the largest racial/ethnic group was Latinx (39.8 percent). About one fifth of students did not report their gender identity; of those who reported, most (44.1 percent) identified as cisgender women. For students who reported level of parental education, the largest percentage reported an education level of high school diploma (16.7 percent).
Table 1. Descriptive Statistics of Survey Sample
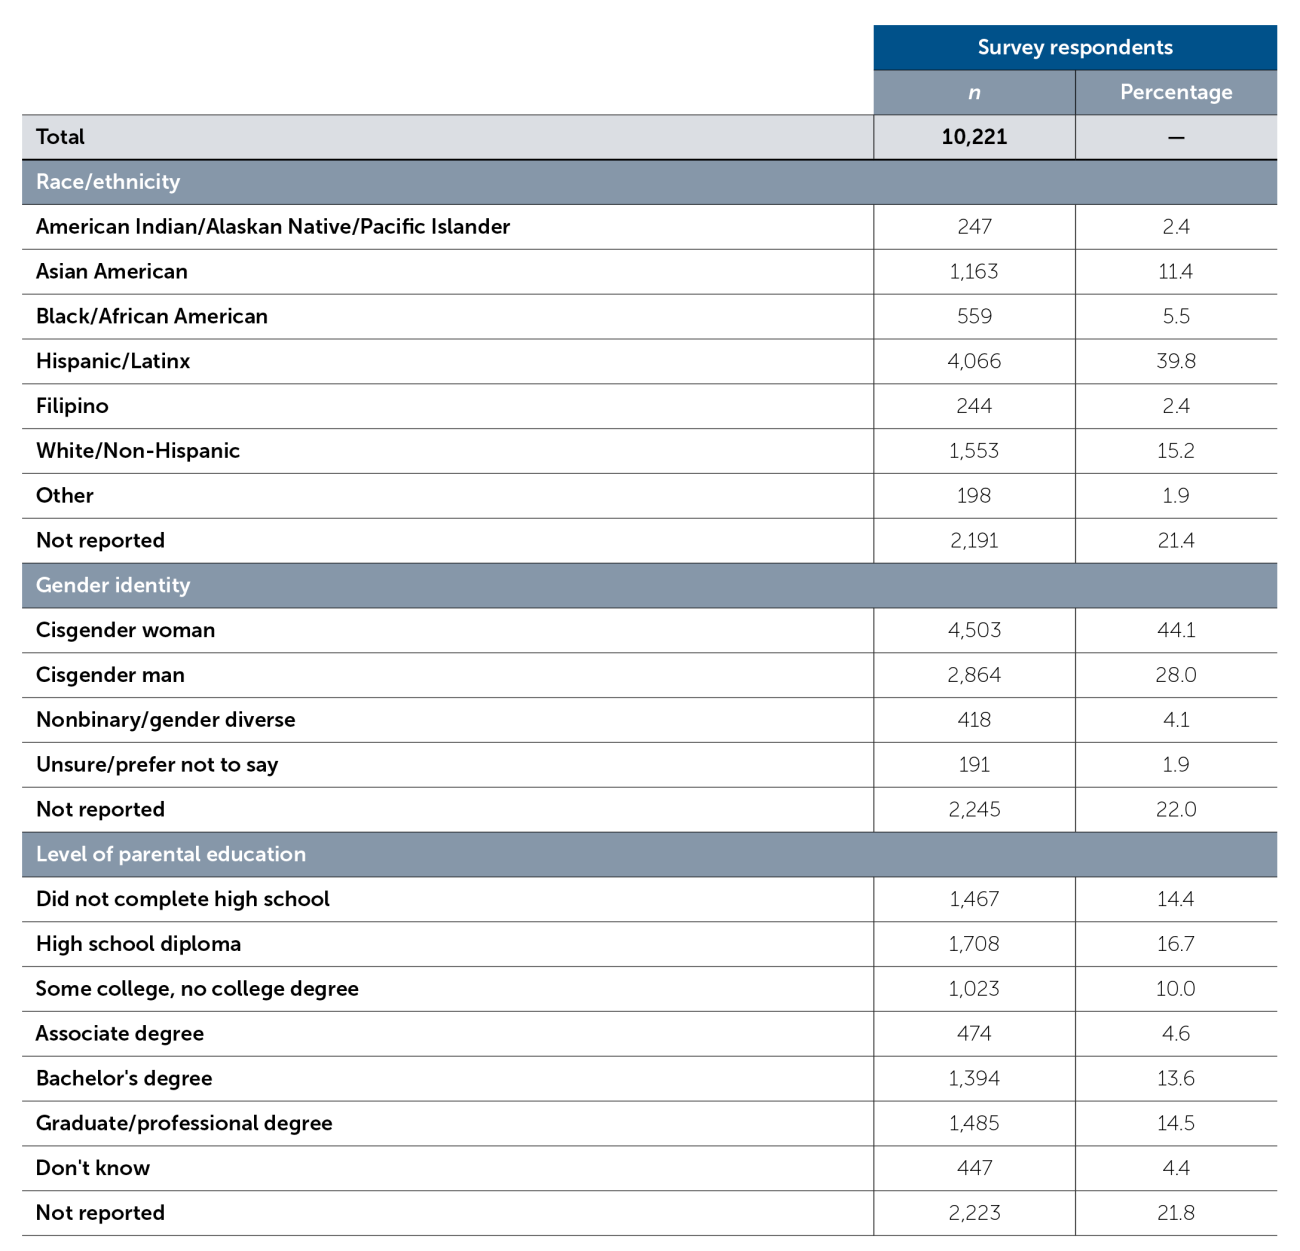
Note. Although the California Department of Education’s DataQuest uses slightly different racial categories in its reporting of student data, the sample we analyzed marginally over- and underrepresents some subgroups of students. Specifically, compared to the full cohort of 12th graders attending public high schools in California in 2023 (n = 488,936), our survey sample overrepresents both American Indian/Alaskan Native/Pacific Islander (0.9 percent of the full cohort of CA data) and Black/African American students (4.9 percent of the full cohort) by about one percentage point and Asian American students (9.5 percent of the full cohort) by two percentage points, while Hispanic/Latinx students (55.7 percent of the full cohort) are underrepresented in our sample by nearly 16 percentage points. Additionally, gender identity data for the survey sample include different categories than those available through DataQuest, which reports that 48 percent of public high school 12th graders were female, 51.5 percent were male, and less than one half of 1 percent were nonbinary in 2023.
College Advising and Preparedness
Two thirds of high school seniors were satisfied with the college advising they received and felt prepared for college.
To reflect on their perceived support in the transition out of high school, seniors were asked about their experiences with advising and their level of preparedness for college. Approximately two thirds of college-going seniors were satisfied with the college advising they received in high school, with 66.2 percent indicating they somewhat agree or strongly agree with the statement “I received good advising from high school about college” (Figure 1). Asian American and White students, along with nonbinary/gender-diverse students and students with higher parental education levels, were less likely to be satisfied with their college advising.
I believe remaining consistent [with] my academics will [be] the biggest challenge. I personally don’t believe I’m prepared to pass college-level classes. Yet I notice … most of [the] class of 2023 aren’t prepared as well."
Figure 1. College Advising in High School
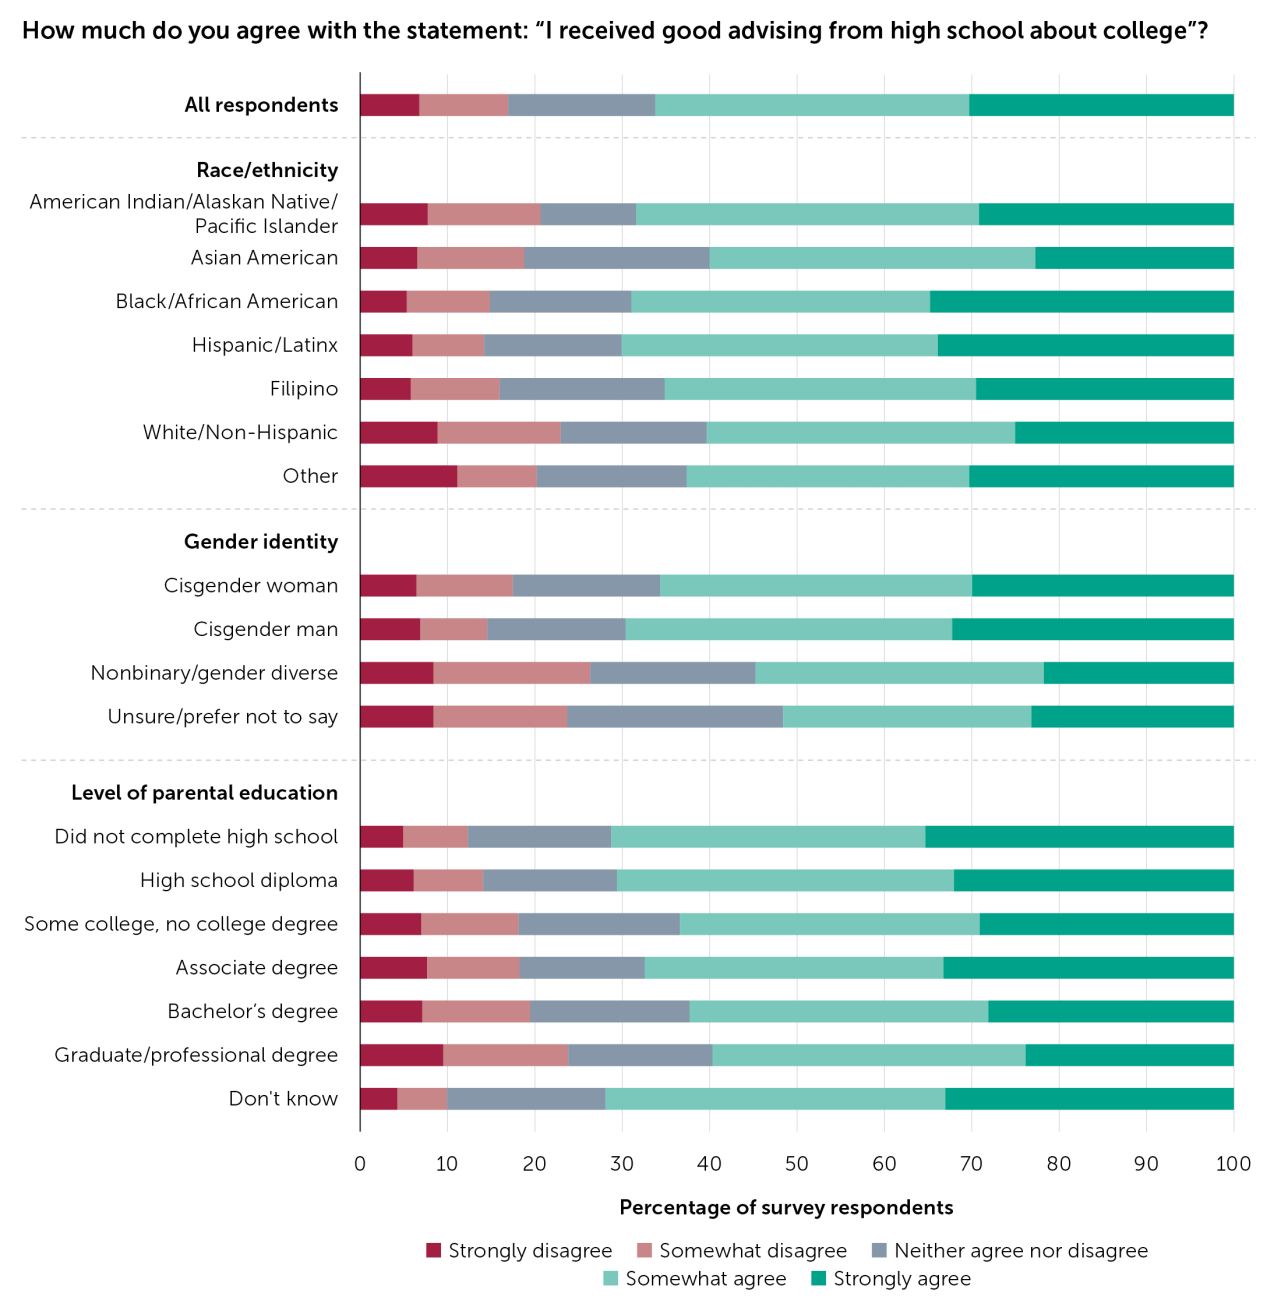
Note. Rates depicted in the figure represent 8,137 survey respondents who answered this question. Racial/ethnic, gender identity, and level of parental education subgroups exclude respondents who did not provide a response for the respective demographic question within the survey.
Nearly 63 percent of the seniors surveyed felt prepared for college prior to enrollment.
Two thirds of seniors reported feeling prepared for college, indicating that they somewhat agree or strongly agree with the statement “I feel prepared for college,” with 21.1 percent indicating they strongly agree that they felt prepared (Figure 2). Results by subgroup reveal that White and cisgender male students were more likely to strongly agree they were prepared, compared to their counterparts in other race/ethnicity and gender identity subgroups. Students whose parents had higher education levels also reported higher rates of college preparedness relative to students with lower levels of parental education.
[The biggest challenge will be] being away from home. I’m excited to be leaving, but everything I’ve loved my entire life is staying here: my family, my pets, my friends. It hurts knowing people change after high school, and my biggest fear is my friends [will] stop keeping in contact with me because I’m moving 12 hours [away] up north.”
Figure 2. College Preparedness
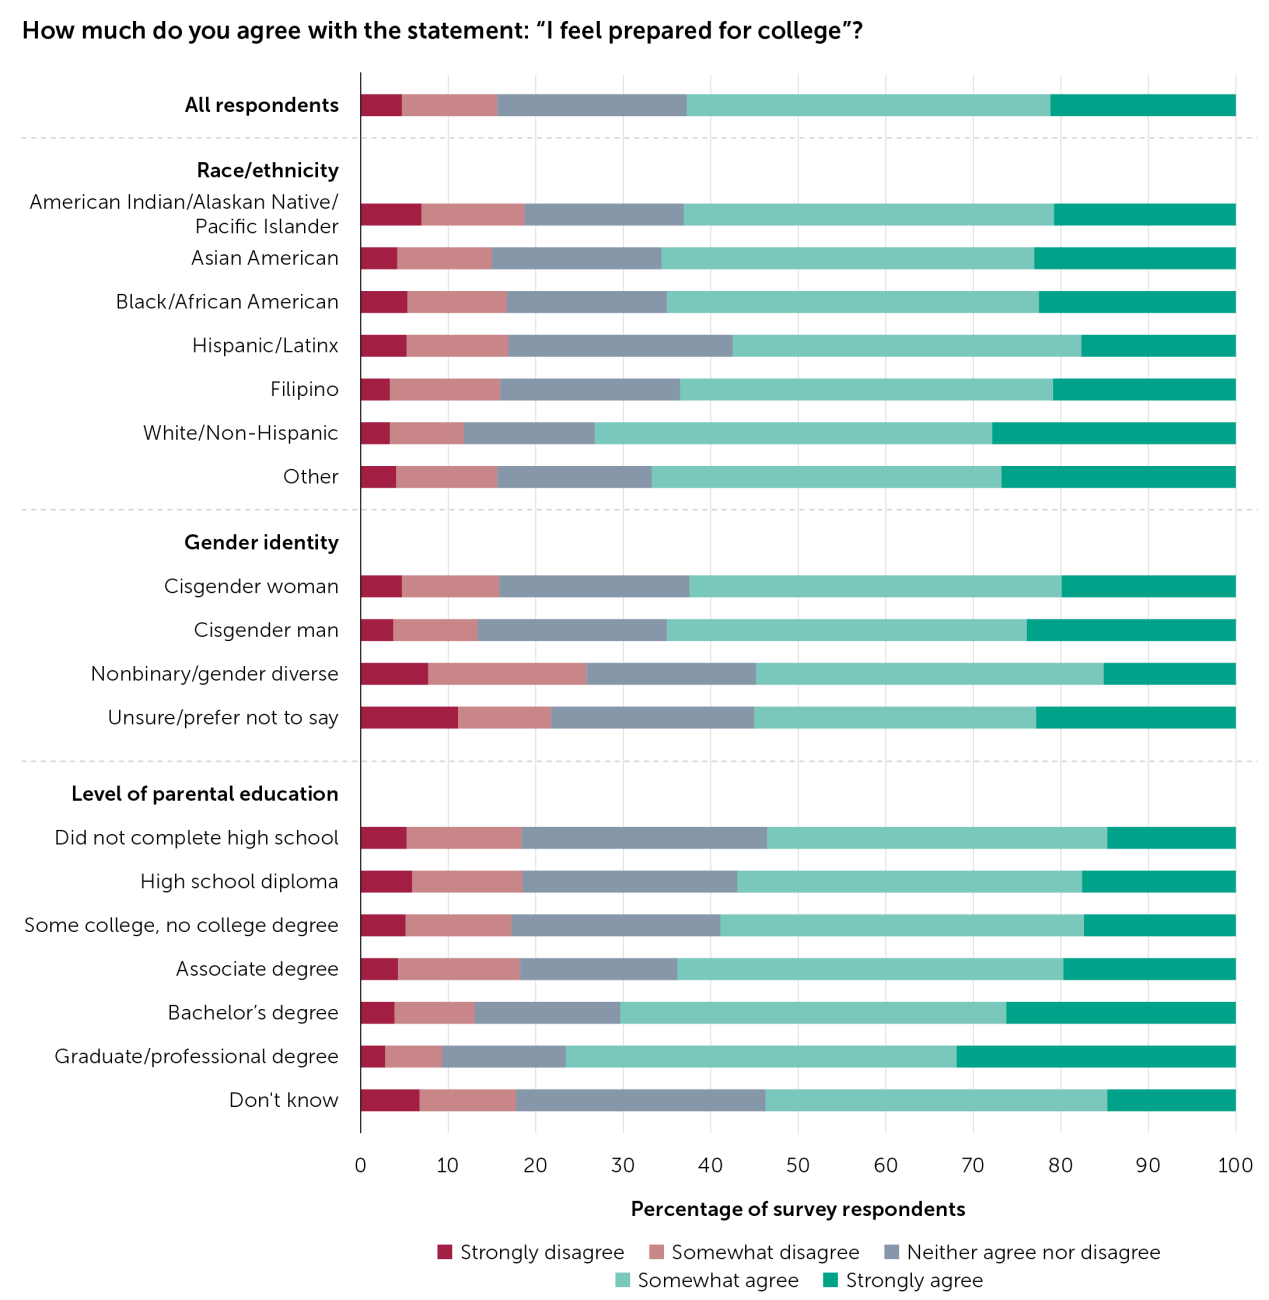
Note. Rates depicted in the figure represent 8,133 survey respondents who answered this question. Racial/ethnic, gender identity, and level of parental education subgroups exclude respondents who did not provide a response for the respective demographic question within the survey.
College Plans
More than 38 percent of students planned to enroll in community college, and nearly 44 percent of students planned to attend one of the state’s 4-year public universities.
An overwhelming majority—nearly 90 percent of the students in our sample—reported that they planned to attend an in-state college in the fall of 2023 (Figure 3).6 Many students (38.4 percent) intended to matriculate to one of the state’s 116 community colleges while about 22 percent of students planned to attend California State University (CSU) or University of California (UC). A little over 10 percent of respondents reported their intention to attend a college outside of California.7
We note some important differences in college plans across demographic characteristics. Although the majority of Latinx students (46.6 percent) planned to enroll in a community college in the fall, most Asian American students (43.3 percent) planned to attend a UC. Additionally, White students indicated plans to enroll in a college outside of California at higher rates (22.1 percent) than their peers from other racial/ethnic groups. We also find slight differences in enrollment by gender identity, as gender-diverse students were 12.8 percent more likely to pursue enrollment at a postsecondary institution outside of California than their counterparts. As with college preparation, parental education level was associated with students’ college plans: The higher the level of parental education, the more likely a student reported their plans to enroll in a UC. Moreover, students whose parents had earned a bachelor’s degree or graduate degree were more likely (by 16.4 percent and 24.9 percent, respectively) to report plans to attend a college outside of California.
Figure 3. Plans for College Enrollment
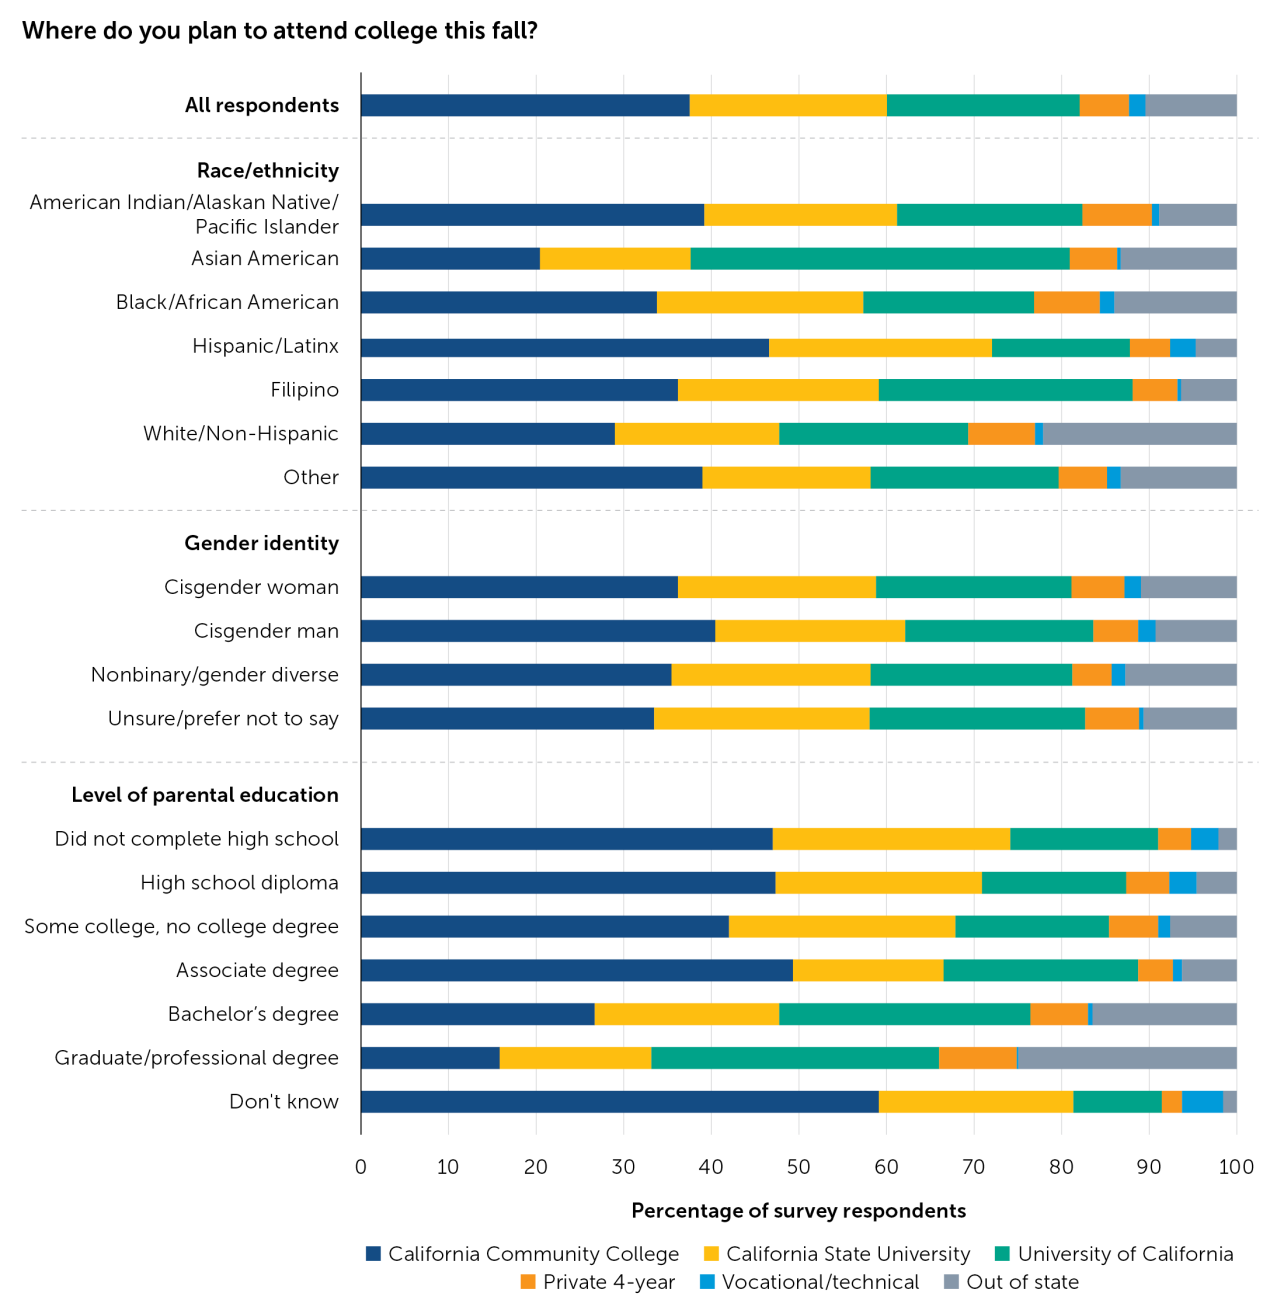
Note. Rates depicted in the figure represent 9,172 survey respondents who indicated plans to attend college and provided answers to the respective demographic question within the survey. Of the full survey sample (n = 10,221), 9,230 respondents indicated that they planned to go to college, 170 said they did not plan to attend college, 394 expressed that they didn’t know, and 527 did not respond to the question.
Engineering, natural sciences, and health sciences were the most popular anticipated fields of study for seniors from the class of 2023.
Students were asked what field of study they anticipated pursuing in college (Table 2). Overall, most students planned to study engineering (16 percent), natural sciences (15.7 percent), and health sciences (15 percent). Although these three fields of study were highly selected across racial and ethnic groups, we do observe some differences by subgroups. For example, among Asian American students, engineering and natural sciences were more likely to be selected (by 26.7 percent and 23.6 percent, respectively), while Filipino students were more likely to note health sciences as their intended area of study (21 percent). Plans for fields of study in college also differed by gender identity; notably, among cisgender men, 30 percent planned to study engineering—nearly 10 percentage points higher than any other gender identity we surveyed. In contrast, 27 percent of gender-diverse students selected humanities and the arts for future study, a significantly higher rate than the overall rate for that field (11.1 percent). We also found that students whose parents had earned bachelor’s and graduate degrees were more likely to select engineering and natural sciences. Comparatively, students whose parents had received an associate degree or high school diploma or had not completed high school were more likely to indicate plans to study health science (19.1 percent, 17.9 percent, and 17.5 percent, respectively).
I think transportation is going to be my biggest challenge. I live 40 minutes away, which makes me a little anxious, and I’m not exactly sure how it’s going to go, which is the reason why I’m planning on taking half of my classes online and the rest in person to make things a bit easier for me.”
Table 2. Intended Field of Study
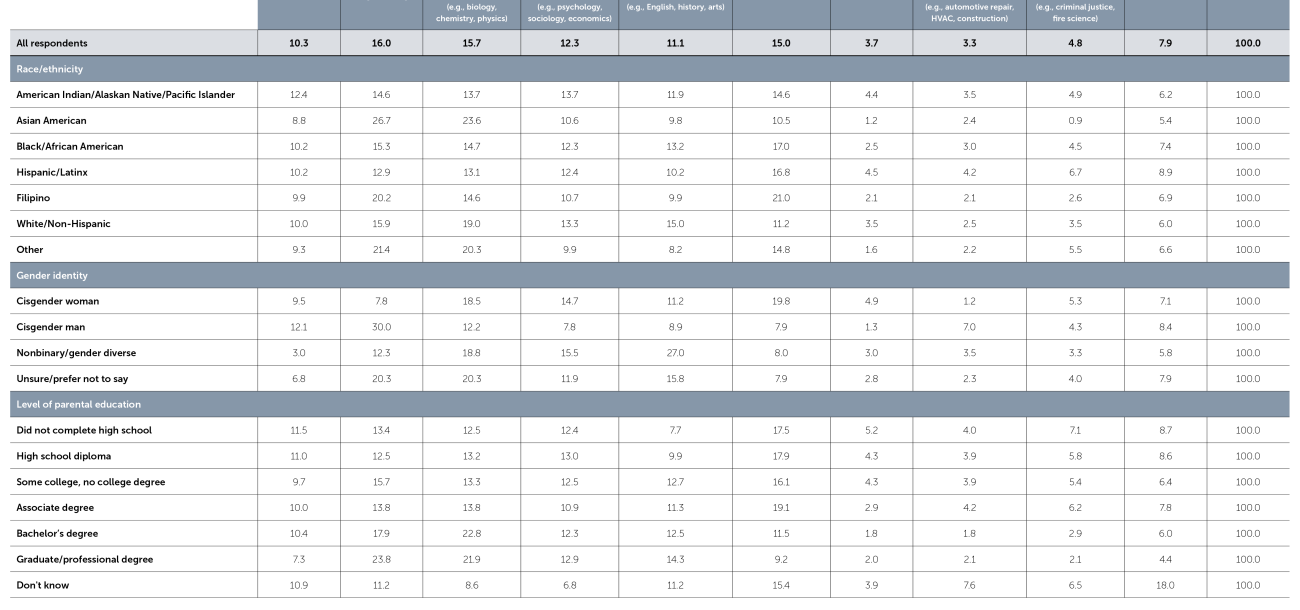
Note. Rates depicted in the table represent 8,815 survey respondents who answered this question. Racial/ethnic, gender identity, and level of parental education subgroups exclude respondents who did not provide a response for the respective demographic question within the survey.
About 58 percent of students planned to enroll in at least one online college course in the fall.
Given students’ prior experiences with remote instruction during the pandemic and the increased number of online offerings by colleges and universities, we asked students whether they planned to take any college courses online. Nearly 42 percent of seniors indicated they would not be taking any online college courses, but about 58 percent intended to take at least one class online, with most planning to take one or two classes (43.5 percent), and 2 percent planning to take all their classes remotely (Figure 4). While the results were largely similar across gender identity subgroups, they differed slightly by race/ethnicity and level of parental education; White students and students whose parents had earned at least a bachelor’s degree were less likely to include enrolling in online classes in their postsecondary plans when compared to their peers. This was particularly true for seniors whose parents had earned a graduate degree; these students had the lowest rates of online course-taking plans overall (44.6 percent).
Figure 4. Planned Enrollment in Online College Courses
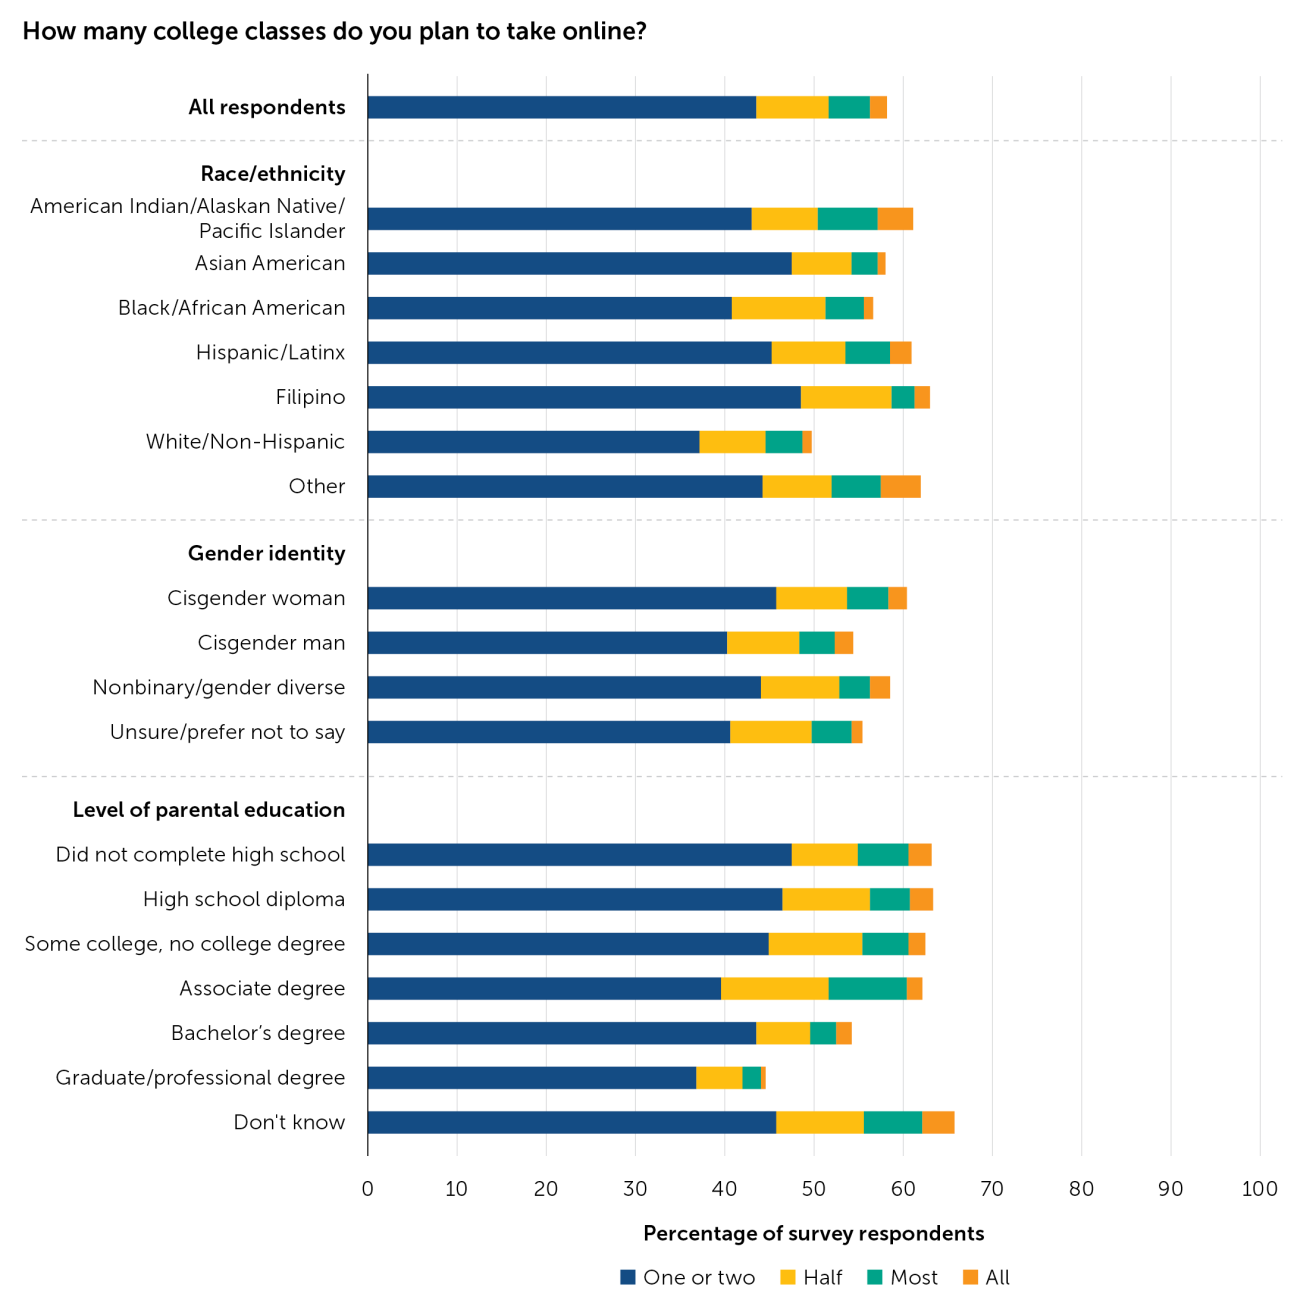
Note. Rates depicted in the figure represent 7,904 survey respondents who answered this question. Racial/ethnic, gender identity, and level of parental education subgroups exclude respondents who did not provide a response for the respective demographic question within the survey.
Concerns About College
Since the transition to college includes a host of new experiences, we asked respondents about their level of concern across several factors (e.g., academics, family, community, being away from home, mental health support, tuition, living expenses). These results are presented in Figure 5. By and large, students were not very worried about certain aspects of college; for example, many students (45.9 percent) had few concerns about living away from home.8 However, some students were very worried about being able to afford college and living expenses (31.1 percent and 27.6 percent, respectively), their academic performance in college (18.9 percent), and whether they would find community (16.3 percent).
Figure 5. Concerns About College
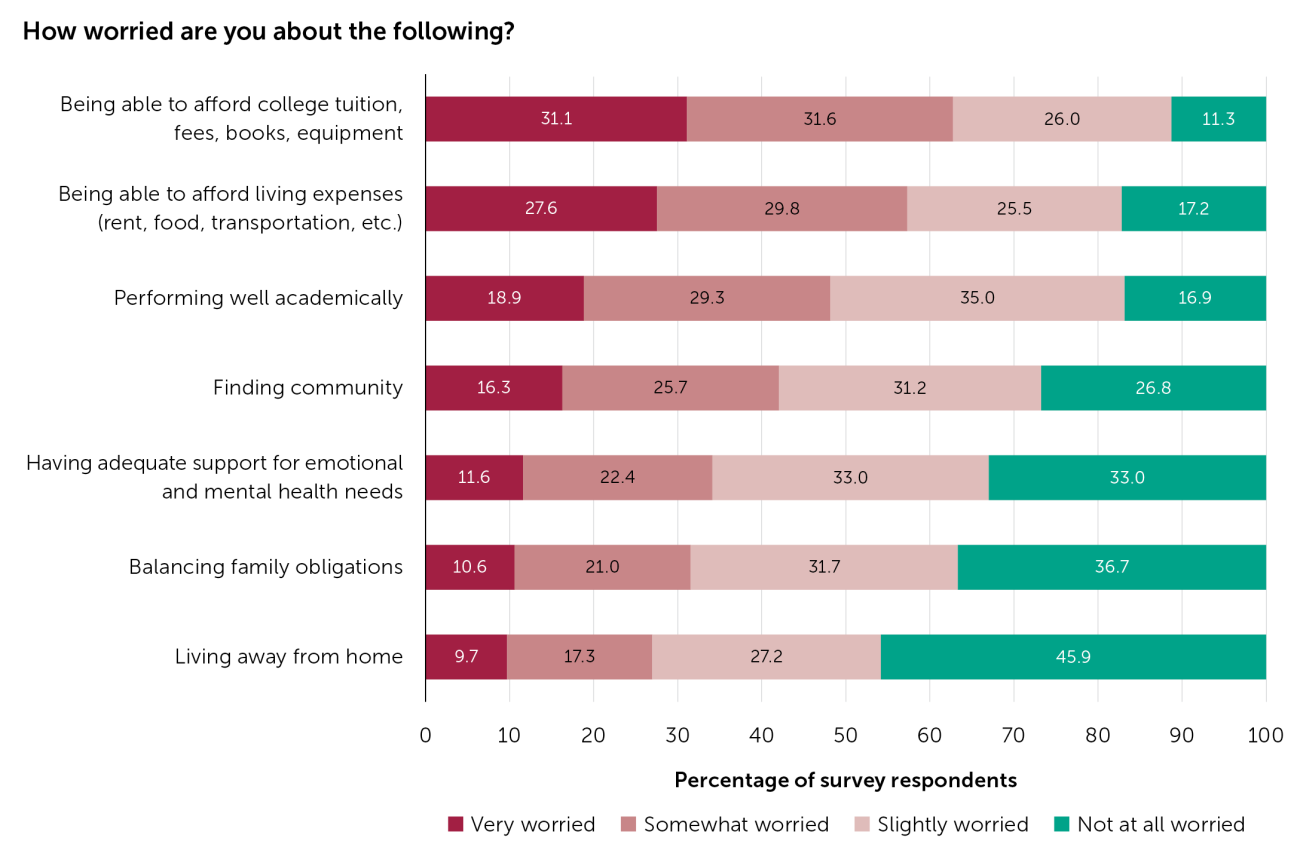
Note. Rates depicted in the figure represent the survey respondents who answered each of the questions about worry: academic performance (n = 7,958); being able to afford college tuition, fees, books, and equipment (n = 7,957); being able to afford living expenses (n = 7,956); living away from home (n = 7,948); support for mental health (n = 7,944); balancing family obligations (n = 7,941); and finding community (n = 7,934).
In Tables 3 and 4 we present students’ most intensely reported worries (i.e., the percentage who indicated they are very worried for each concern) by student subgroup. For the most part, students—regardless of race/ethnicity—were very worried about their academic performance (Table 3) and the financial costs associated with college, particularly college tuition and fees (Table 4).9 Being able to afford college tuition was a predominant worry for Black students (33.3 percent), but slightly more of these students (34 percent) noted that the living expenses associated with college were also a heightened concern. In contrast, for Asian American students, academic performance was the second most pressing concern after paying for college. Among gender-diverse students, concerns were relatively equal across several areas, including the availability of adequate emotional and mental health support (26.3 percent), opportunities to find community (25.3 percent), and academic performance (22.8 percent). It is worth noting that for these students, it appears that social factors that supported a sense of belonging and safety on college campuses came before concerns about academics. In contrast, both cisgender women and cisgender men were more concerned about their academic performance in college (20.8 percent and 14.9 percent, respectively).
Table 3. Heightened Academic and Social Concerns About College
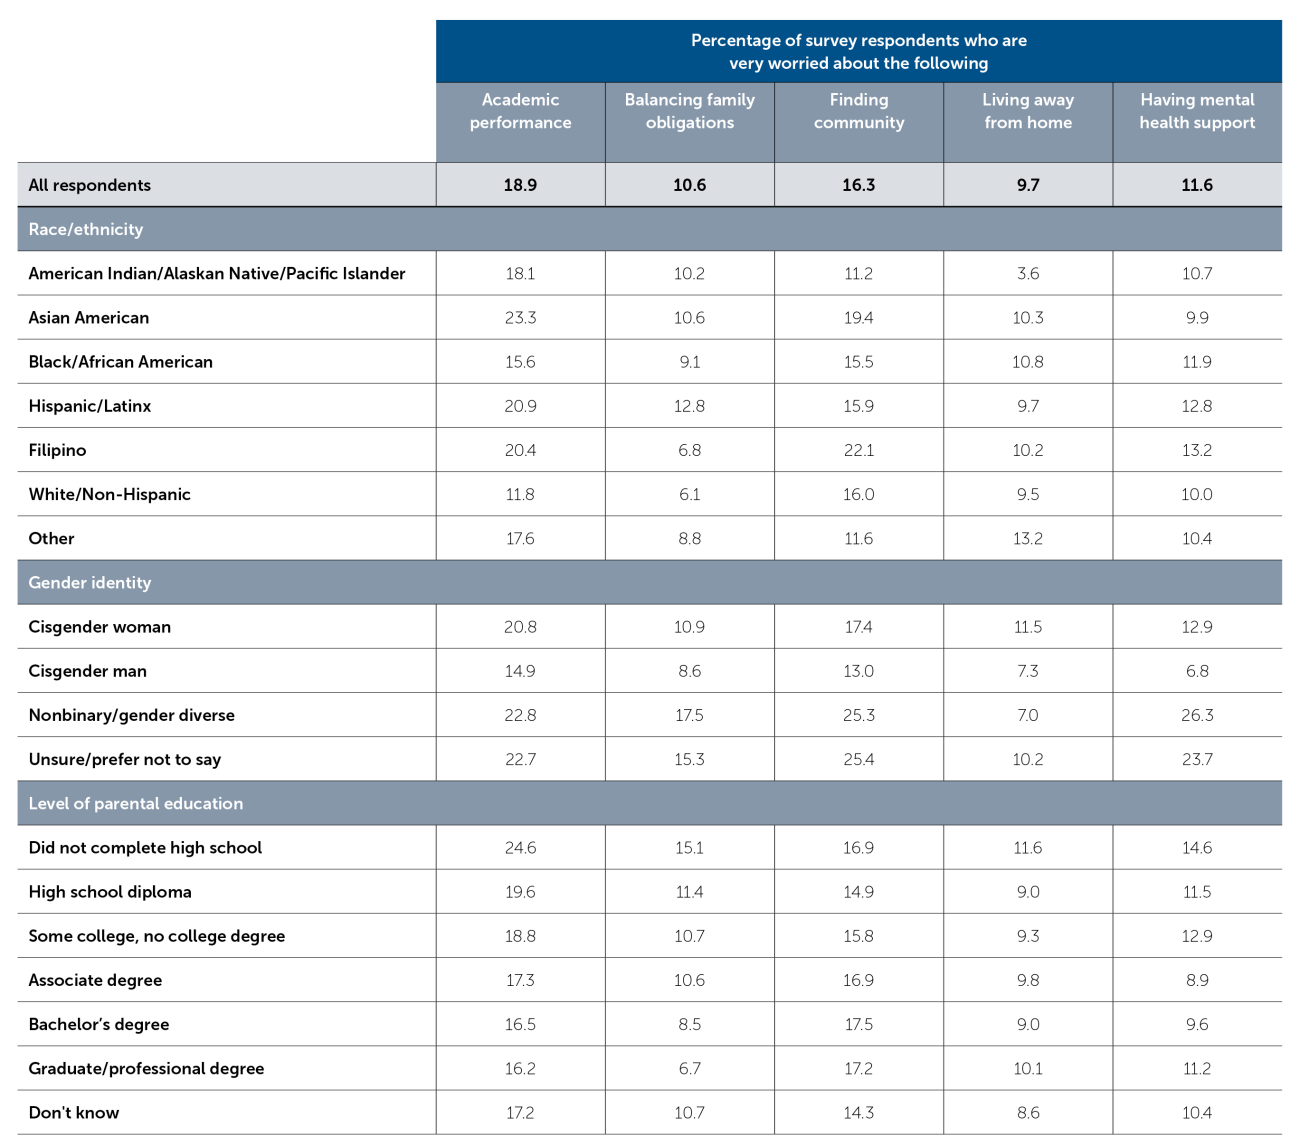
Note. Rates depicted in the table represent the survey respondents who answered each of the questions about worry: academic performance (n = 7,958); balancing family obligations (n = 7,941); finding community (n = 7,934); living away from home (n = 7,948); and support for mental health (n = 7,944). Racial/ethnic, gender identity, and level of parental education subgroups exclude respondents who did not provide a response for the respective demographic question within the survey.
Table 4. Heightened Financial Concerns About College
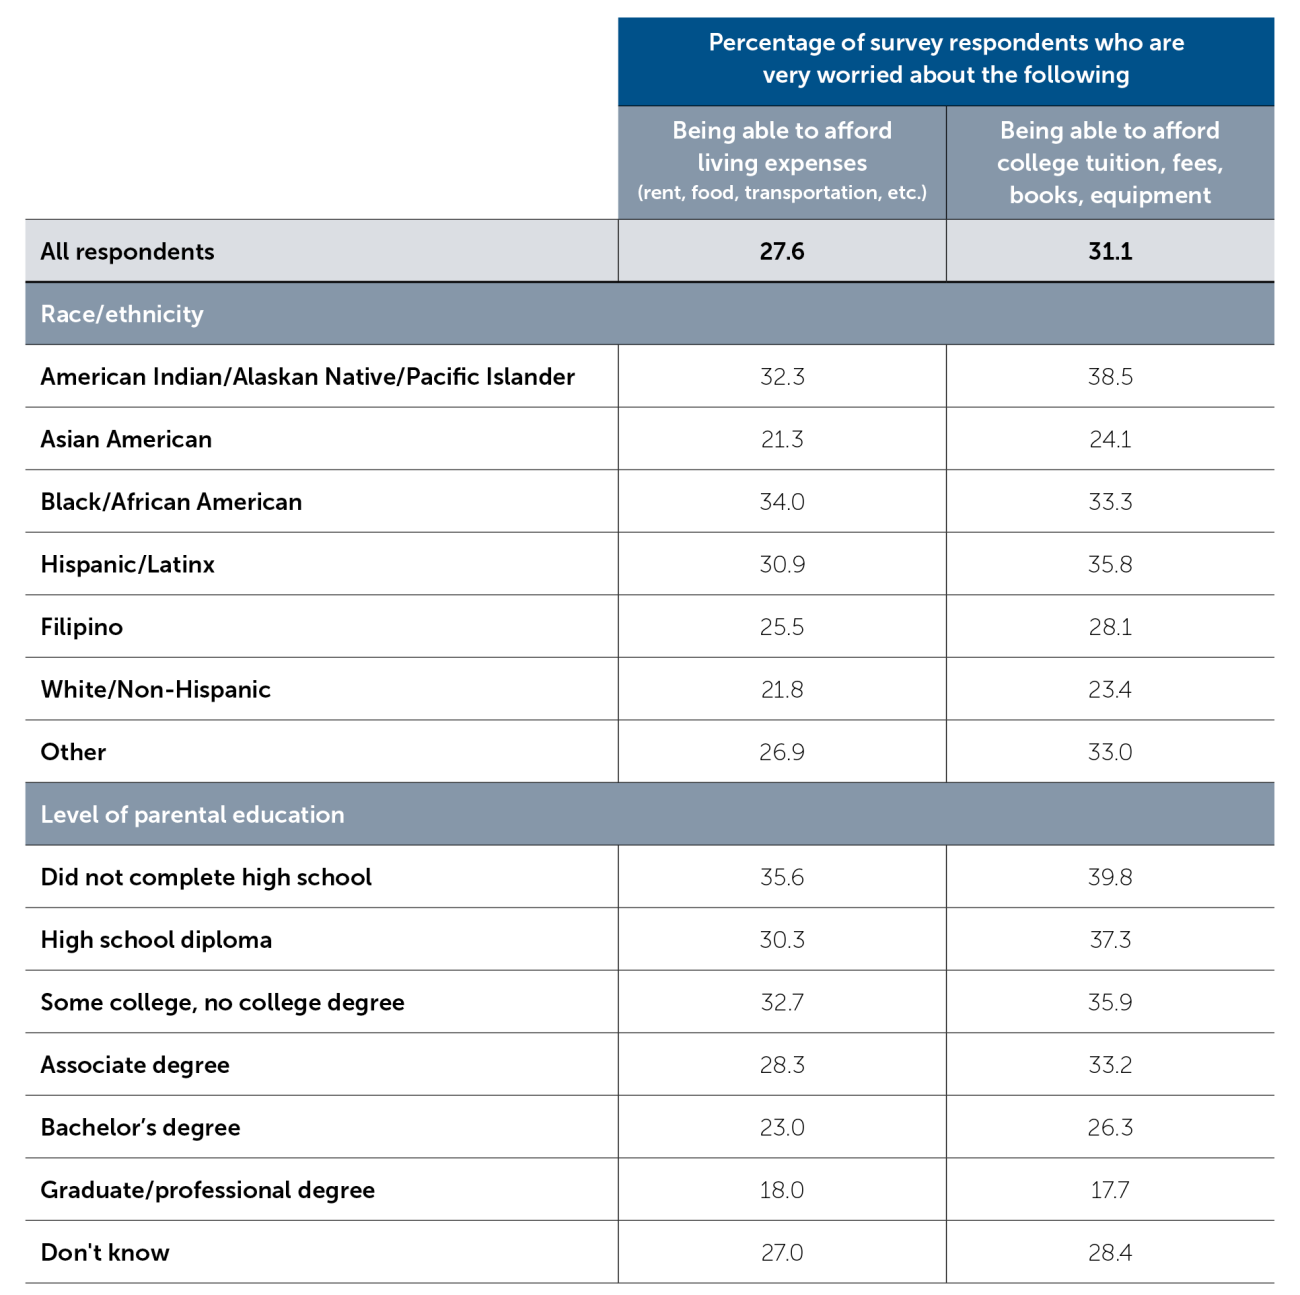
Note. Rates depicted in the table represent the survey respondents who answered each of the questions about worry: being able to afford college tuition, fees, books, equipment (n = 7,587) and being able to afford living expenses (n = 7,588). Racial/ethnic and level of parental education subgroups exclude respondents who did not provide a response for the respective demographic question within the survey.
Excitement for College: Student Voices
In a separate open-ended question, seniors were asked: “What are you most excited about for college?” Students described a range of aspects about college-going that they anticipated, many of which were underscored by the theme of newness. Broadly, students were looking forward to new experiences, including meeting new people and learning new things. One student responded: “I am [the] most excited for the things I’ll learn and discover and the people I’ll meet along the way.”
Several students also considered their upcoming matriculation an opportunity for “a new chapter,” “a fresh start,” and “new beginnings,” suggesting this would be more than a simple transition from one schooling institution to another—it would be, perhaps unsurprisingly, a turning point in their lives. Moreover, much of this excitement was related to the people they hoped to encounter and the relationships they looked forward to building. For example, one student noted: “I am most excited [about] meeting new people with a wide variety of new perspectives. I love learning new things and I think learning more about the world through people is very important.” Relatedly, another student wrote: “I am the most excited to learn in a community that truly values learning and be able to build a community for myself where I truly feel that I belong.”
This learning extended to personal growth, as one student anticipated “finding [them]self” in college while another was excited to “grow in the education [they would] receive and see ... the person [they would] become throughout college.”
Students touched on the fact that this moment extended beyond their own experiences, with several seniors mentioning their parents in relation to their own excitement. One student, who self-identified as a first-generation college student, wrote that they wanted to “make [their] parents proud,” and another said they were looking forward to “being able to get the education my parents never could.” The excitement students described thus captured multiple facets of college going, including new academic, social, and personal opportunities that could be shared with family. In the words of one student:
I am excited to explore student life as independently as I can. I want to really feel what it may be like to be an active student on the go, or even on the slow. I am excited to achieve academic heights and experience a school life where I have the choice to control certain variables like class and schedule, and work to better understand and establish my own work ethic. Most of all, I am excited to make the most of my college experience, meet new people, and learn from new perspectives.”
Conclusion
The high school graduating class of 2023 represents yet another cohort of students for whom schooling was marked by unprecedented disruption, characterized by extended remote learning at the onset of high school due to a global pandemic. As such, these students’ experiences and how they may have shaped students’ plans and preparation for college represent an important marker of the transition from high school to college for recent graduating cohorts. To improve understanding of the learning context and readiness of these students, this work reports the results of a large-scale survey of California high school seniors who intended to enroll in college in the fall of 2023. Results reveal varying student perspectives about their preparation as well as their hopes for and trepidations about college. Given California’s significant investments in students’ mental health,10 these results suggest that such investments are an important undertaking—particularly as students’ experiences in high school academically, socially, and emotionally color concerns about their college futures. In forthcoming work, we delve more deeply into students’ cost considerations, college affordability, and experiences with financial aid processes.
The authors are grateful to Elizabeth Friedmann, Sherrie Reed Bennett, Paco Martorell, and Scott Carrell for their expertise and support in the construction of the survey, analysis, and review of findings. This research was supported by the College Futures Foundation and conducted in partnership with the California Student Aid Commission. PACE and the California Education Lab at the University of California, Davis, are also thankful for research dissemination support from the Bill & Melinda Gates Foundation.
This policy brief, like all PACE publications, has been thoroughly reviewed for factual accuracy and research integrity. The findings and conclusions here are those of the authors alone and do not necessarily reflect the positions or policies of the funders or of the California Student Aid Commission.
* The following clarification was added in June 2024: The survey instrument collected race/ethnicity data via a multiple choice question with eight response options. Respondents were able to check as many response options as they wished (i.e., "check all that apply"). Rather than group all students who selected two or more races/ethnicities into a single multiracial category, as is commonly practiced, we assigned all students who selected two or more options to a race/ethnicity category following the college-going underrepresented minority (URM) hierarchy: Native American > Black > Hispanic > Pacific Islander > Filipino > Asian > Other > White. In other words, if a student selected two or more options, the student was categorized as the race that is highest on the URM hierarchy.
- 1Overall, college-going rates for California high school students remained relatively steady, if not modestly increasing, until the COVID-19 pandemic. The California Department of Education reports that statewide college enrollment for the most recent year of publicly available data (2020–21) was 62.2 percent, which still reflects the declines of the pandemic; despite some rebound, these rates have not hit prepandemic levels, which were at their height in 2018 at nearly 68 percent.
- 2Recently released surveys on high school students’ experiences tend to draw on a narrow sample of students, students predominantly enrolled in earlier grades, or data collected before the pandemic. See Austin, G., Hanson, T., Bala, N., & Zheng, C. (2023). Student engagement and well-being in California, 2019–21: Results of the Eighteenth Biennial State California Healthy Kids Survey, Grades 7, 9, and 11. WestEd. data.calschls.org/resources/18th_Biennial_State_1921.pdf; Horowitz, J. M., & Graf, N. (2019, February 20). Most U.S. teens see anxiety and depression as a major problem among their peers. Pew Research Center. pewresearch.org/social-trends/2019/02/20/most-u-s-teens-see-anxiety-and-depression-as-a-major-problem-among-their-peers; Kosciw, J. G., Clark, C. M., & Menard, L. (2022). The 2021 National School Climate Survey: The experiences of LGBTQ+ youth in our nation’s schools. GLSEN. glsen.org/sites/default/files/2022-10/NSCS-2021-Full-Report.pdf; Reber, S., & Smith, E. (2023). College enrollment disparities: Understanding the role of academic preparation. Center on Children and Families at Brookings. brookings.edu/wp-content/uploads/2023/02/20230123_CCF_CollegeEnrollment_FINAL2.pdf; YouScience. (2023). Gender diversity in K–12 education and career readiness [Research report]. resources.youscience.com/ rs/806-BFU-539/images/2023_PostGraduationReadinessReport_PartTwo.pdf
- 3Reed, S., Friedmann, E., Kurlaender, M., Martorell, P., Rury, D., Fuller, R., Moldoff, J., & Perry, P. (2022). Disparate impacts of COVID-19 disruptions for California college students. Journal of Student Financial Aid, 51(1), 7. doi.org/10.55504/0884-9153.1789; Reed, S., Kurlaender, M., Martorell, P., Rury, D., Hernandez Negrete, A., Perry, P., Moldoff, J., & Fuller, R. (December 2020). College uncertainties: California high school seniors in spring of 2020 [Report]. California Student Aid Commission and California Education Lab. csac.ca.gov/sites/main/files/file-attachments/csac_survey_report_20201217.pdf?1608251478
- 4We present results on gender identity for the following five categories: cisgender woman, cisgender man, nonbinary/gender diverse, unsure/prefer not to say, and not reported. We define the “nonbinary/gender diverse” category to include students who identify as nonbinary (one whose gender identity falls outside of the typically defined gender binary) as well as a broader term, gender diverse, which captures the other gender identities students shared in open response on the survey form. Some gender identities from our sample captured by the term gender diverse include agender, genderqueer, and two spirit, among many others.
- 5It is important to note that not every high school senior in our sample answered every survey question. This may be for several reasons; for example, a respondent might intentionally ignore certain questions, forget to answer a question, or perceive a question to be inapplicable. As missing data in our results appeared to be omitted at random—some students chose not to respond to questions about demographic characteristics—any missing data are excluded from the present analysis.
- 6These results reflect the students who reported their intent to enroll in college in the fall after graduation (n = 9,230). Although high school students were required to submit a FAFSA or CADAA, and thus financial aid applicants may be more representative of the broader population of the graduating class than previous cohorts, self-selection may nevertheless play a role in the high rates of planned college enrollment in the results. This is particularly attributable to how students were notified of the survey—through several emails sent by the state agency responsible for administering financial aid programs for students in California—and the intrinsic factors (i.e., motivation) that guide decision-making, including survey response. Additionally, plans to enroll in college do not necessarily equate to actual enrollment; in this case, they reflect a student’s intention to matriculate in May of their senior year.
- 7This differs from prior work conducted by the authors on the postsecondary destinations of California high school students. Historically, more California high school graduates tend to enroll in one of the state’s community colleges than in a 4-year university. In fact, our previous report finds that among college enrollees, 57 percent of students enrolled in a community college and 28 percent in a 4-year in-state university. In more recent work that examined the college-enrollment patterns of Latinx high school students in California, results revealed that, statewide, 37 percent of Latinx students enrolled in a community college in the fall after graduation while about 18 percent enrolled in a UC or CSU. See Kurlaender, M., Reed, S., Cohen, K., Naven, M., Martorell, P., & Carrell, S. (2018, December). Where California high school students attend college [Report]. Policy Analysis for California Education. edpolicyinca.org/publications/where-california-high-school-students-attend-college; Martinez, M. N., Cuellar, M. G., Reed, S., & Esposito-Noy, C. (2023, June). Enlace comunitario: Identifying opportunities to enhance community college outreach and recruitment of Latinx/a/o students [Research brief]. Wheelhouse: The Center for Community College Leadership and Research, University of California, Davis. education.ucdavis.edu/sites/ main/files/mark_wheelhouse_research_brief_vol_8_n_2_final_2.pdf
- 8This survey was administered in May 2023, prior to recent events that have left many concerned about antisemitism and Islamophobia on college campuses.
- 9In this work, we present students’ financial concerns about college by race/ethnicity and level of parental education. Forthcoming work explores this along with other dimensions of the schooling experience of high school seniors, with a lens more richly applied to gender identity.
- 10California Department of Health Care Services. (n.d.). Children and youth behavioral health initiative. dhcs.ca.gov/cybhi


