Subtraction and Substitution


Summary
This brief, a companion to the report Subtraction and Substitution: Shifts in High School Math Course-Taking, examines how schools shape math course-taking among California high school students. Results indicate that whether students enroll in math in 12th grade and what kinds of courses they take differ as a result of the schools students attend. Math course offerings in California have changed over the past decade such that not all students have access to the most advanced math coursework. Students in small schools and schools with higher shares of socioeconomically disadvantaged students were less likely to take advanced math in 12th grade. Moreover, in two thirds of high schools, 12th-grade math enrollment has declined during the past 5 years.
Introduction
This brief accompanies the recently released report Subtraction and Substitution: Shifts in High School Math Course-Taking.30 Using student-level course data for ten recent cohorts of high school seniors, Dykeman et al. uncovered several noteworthy trends in mathematics course-taking. For example, about 70–75 percent of high school seniors enrolled in math courses from 2015 through 2024,31 while 25–30 percent did not enroll in a math course at all during their senior year. The proportion of students taking any math course during their senior year increased from about 71 percent in 2015 to about 75 percent in 2019 but then declined about four percentage points (back to 2015 levels) by 2024. The report also finds that 75 percent of high school students enrolled in the highest math course necessary for admissions eligibility at California’s public 4-year universities (Algebra 2 or its equivalent)—a rate that has remained stable over the last decade.32 At the same time, enrollment in some advanced math courses has decreased. Compared to 2015, students in the 2024 cohort were less likely to enroll in precalculus (45.9 percent in 2015 vs. 33.4 percent in 2024) and calculus (17.8 percent in 2015 vs. 14.2 percent in 2024). Finally, the report notes a modest increase in statistics course enrollment over the past decade.
Math enrollment in 12th grade is positively related to college enrollment and persistence, especially if those courses are advanced.33 Although many individual-level factors can influence whether students enroll in math and which classes they take, schools play a critical role in students’ course-enrollment decisions.34
In this brief, we focus on differences among California high schools in math course enrollment. The school that a student attends affects the courses available for enrollment, the student’s prior mathematics preparation, and the academic support that the student can access. Previous research has found that schools primarily serving low-income students tend to offer fewer advanced courses as well as fewer resources for college preparation.35 To examine the role that schools play in students’ math course-taking, we extended the findings of the primary Subtraction and Substitution report by exploring how changes in math course-taking manifest in California’s traditional public high schools, including differences based on school characteristics, such as size and socioeconomic makeup. This brief mirrors the structure of the primary report by first examining 12th-grade math course-taking at the school level and then analyzing the math courses taken from Grades 9 through 12.
Data
To examine school-level enrollment, we used 2024 data from the California Department of Education’s California Longitudinal Pupil Achievement Data System (CALPADS).36 Students were assigned to schools based on their 12th-grade enrollment each year as reported in the CALPADS Cumulative Enrollment files. We constructed a primary sample of 1,510 traditional California public schools for the 2024 academic year.37 After assigning students to schools, we used the Cumulative Enrollment data to calculate school-level demographics based on 12th-grade enrollment and the socioeconomic status of each school’s senior class.38
To explore course-taking, we used the CALPADS Course Completion files. These data provided a standardized state course code for each course taken by each student while they attend a California public high school. Our analysis of course-enrollment patterns sorts these state course codes into seven policy-relevant categories, presented in Table 1.39 For the purposes of this brief, we aggregated course-taking information at the school level based on students’ Cumulative Enrollment school assignment.
Table 1. Math Course Categories
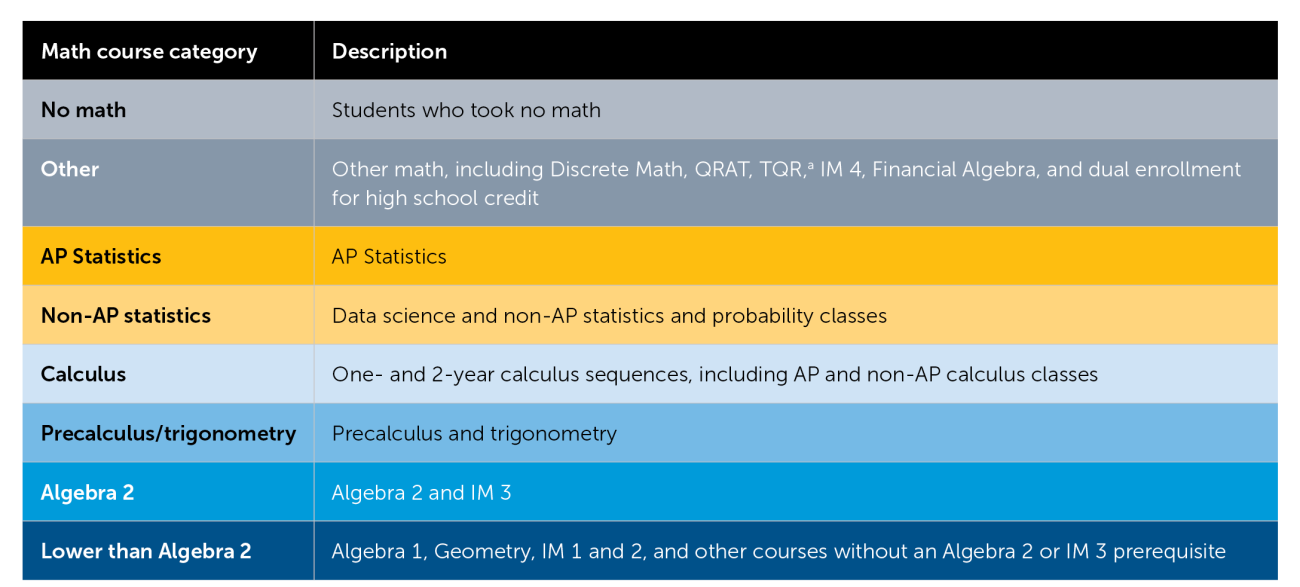
Note. Computer science courses do not count as math courses in our analysis or for completion of Area C of the A–G requirements. a Quantitative Reasoning With Advanced Math Topics (QRAT) and Transition to Quantitative Reasoning (TQR) are two of several math courses designed to serve as a bridge to college-level math for 12th-grade students. All these bridge courses are included in our “Other” category except for data science, which is a non-AP statistics course. IM = integrated math.
Twelfth-Grade Math Course-Taking at the School Level
In two thirds of high schools, 12th-grade math enrollment has declined during the past 5 years.
Findings from the Subtraction and Substitution report indicate that, while the percentage of 12th-grade students enrolling in math increased from 2015 to 2019, the percentage of seniors enrolling in math dropped by about 4 percentage points between 2019 and 2024. Figure 1 presents the distribution of percentage point changes in 12th-grade math enrollment in California high schools during the years of this statewide decline.40 Each bar represents one school’s increase or decrease in percentage points from 2019 to 2024.41 (See Appendix Figure A1 for a depiction of school-level changes in 12th-grade math enrollment between 2015 and 2019.) Notably, a decline in math enrollment is evident in about two thirds (66.7 percent) of high schools across the state, with the median school (shown in yellow) experiencing a drop in 12th-grade math-taking of about 4.3 percentage points.42 Among the schools experiencing a decline, 563 (48.8 percent of total schools) saw a decrease of between zero and 15 percentage points in math-taking, and 17 percent of schools had even steeper declines.43
Figure 1. Percentage Point Change in 12th-Grade Math Enrollment, 2019–24
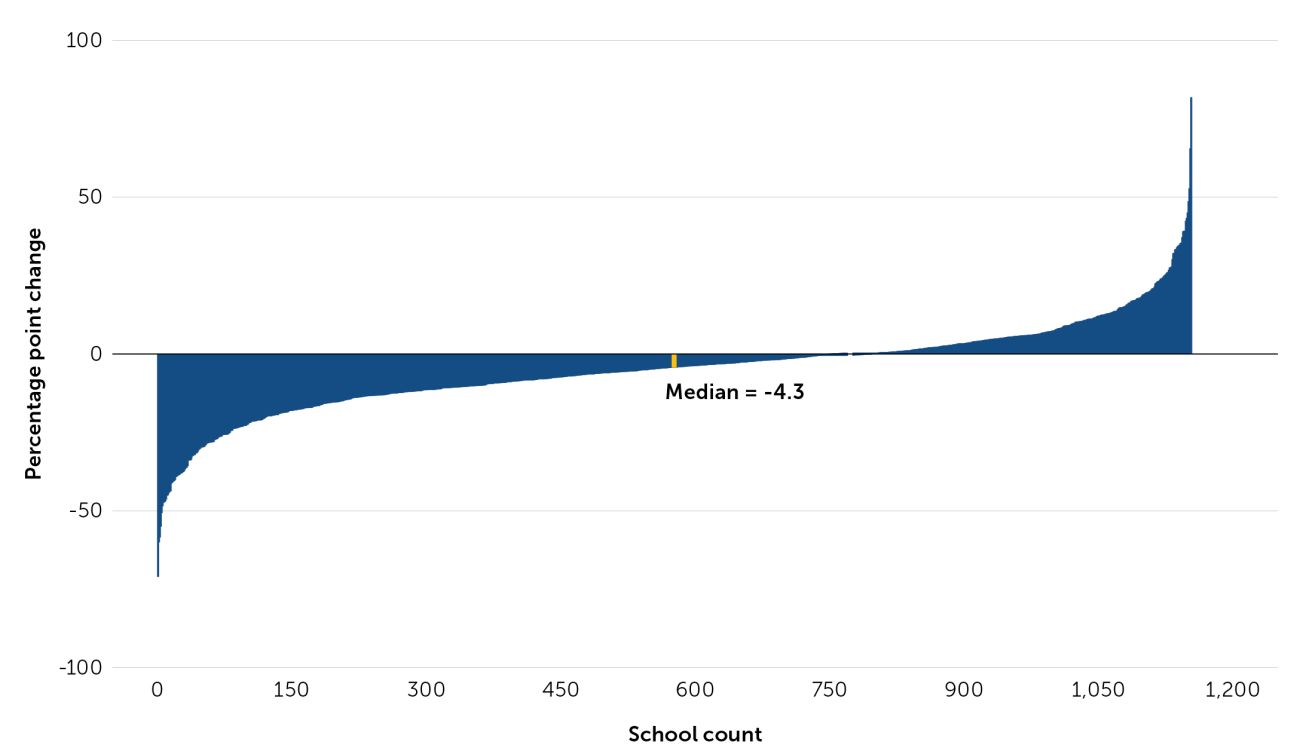
Note. The 2024 cohort is determined by enrollment in 12th grade on April 15, 2024. Each bar represents one school’s percentage of 12th graders enrolled in math in 2024 minus the percentage of 12th graders enrolled in math in 2019 for schools with course data for at least 15 12th graders in every year from 2015 through 2024. Only traditional school ownership codes are included (SOCs 65–67).
In about one third of schools, there were gains in senior year math-taking. Schools where there were increases in 12th-grade math-taking tended to be slightly smaller (with a median cohort size of 288 seniors in 2024) than schools in which math enrollment decreased (with a median cohort size of 347 seniors in 2024). Additionally, schools where math enrollment increased were 4 percentage points more likely to be charter schools than those where math-taking decreased (19.8 percent vs. 15.8 percent). Notably, the concentration of socioeconomic disadvantage and racial composition of schools that experienced enrollment gains and losses is similar (see Appendix Table A4 for details on student demographics at these schools).
How Much of a Role Do Schools Play in Course-Taking?
It is likely that there are differences in math course-taking patterns within schools (a function of student choices, different levels of student preparation, and tracking policies, among other factors) and between schools (a function of differences in course offerings, counseling, or school policies such as graduation requirements). To determine how big a role school differences play in students’ math enrollment, we analyzed the proportion of variance in math course-taking within and between schools using a conditional intraclass correlation coefficient. The intraclass correlation coefficients are derived from linear mixed effects models regressing different course-taking outcomes (e.g., math enrollment in 12th grade, enrollment in Algebra 2, enrollment in statistics, enrollment in AP Statistics, and enrollment in calculus) on student demographics (race/ethnicity, English learner status, gender, and socioeconomic status), with students nested in schools. An intraclass correlation coefficient of 0 would indicate that, conditional on student demographics, all variation in math course-taking is at the student level. Alternatively, a coefficient of 1 would indicate that, conditional on student demographics, students within a given school do not show any individual differences in course-taking, and the only differences in course-taking are between schools. We expect a coefficient somewhere between those two extremes.
We find that after controlling for student demographics, about 17.5 percent of the total variance in 12th-grade math enrollment for the 2024 cohort was explained by differences between schools. Course-taking by graduation also varied across schools. Specifically, conditional on student demographics, differences between schools explained 10.8 percent of calculus enrollment and 13.1 percent of AP Statistics enrollment. School-level variation was even larger for enrollment in less advanced math courses: 25.5 percent of the variation in Algebra 2 participation and 23.2 percent of the variation in regular statistics course enrollment were explained by between-school differences.
Although much of the variation in enrollment and course type is within schools, a sizable amount is between schools. The 10–25 percent variance explained at the school level is consistent with the level of variation found in academic achievement.44 The between-school differences in math course-taking are large enough to warrant further investigation.
Students at smaller schools were more likely to take lower level classes in 12th grade.
School size can affect math enrollment and the types of math courses that students take. Smaller schools may have fewer resources to allocate to math course offerings, limiting educational programs, particularly in high school.45 Figure 2 presents 2024 senior-year math course-taking by school enrollment decile where Decile 1 includes the smallest schools (i.e., those with the fewest 12th graders) and Decile 10 includes the largest schools (i.e., those with the most 12th graders).46 Findings reveal that students enrolled in the smallest schools are the least likely to take any math course during their senior year while schools with more than 61 12th graders (Deciles 3–10) have similar rates of 12th-grade math enrollment; however, the very largest schools have the highest math enrollment, on average.
Figure 2. Twelfth-Grade Math-Taking by School Enrollment Decile
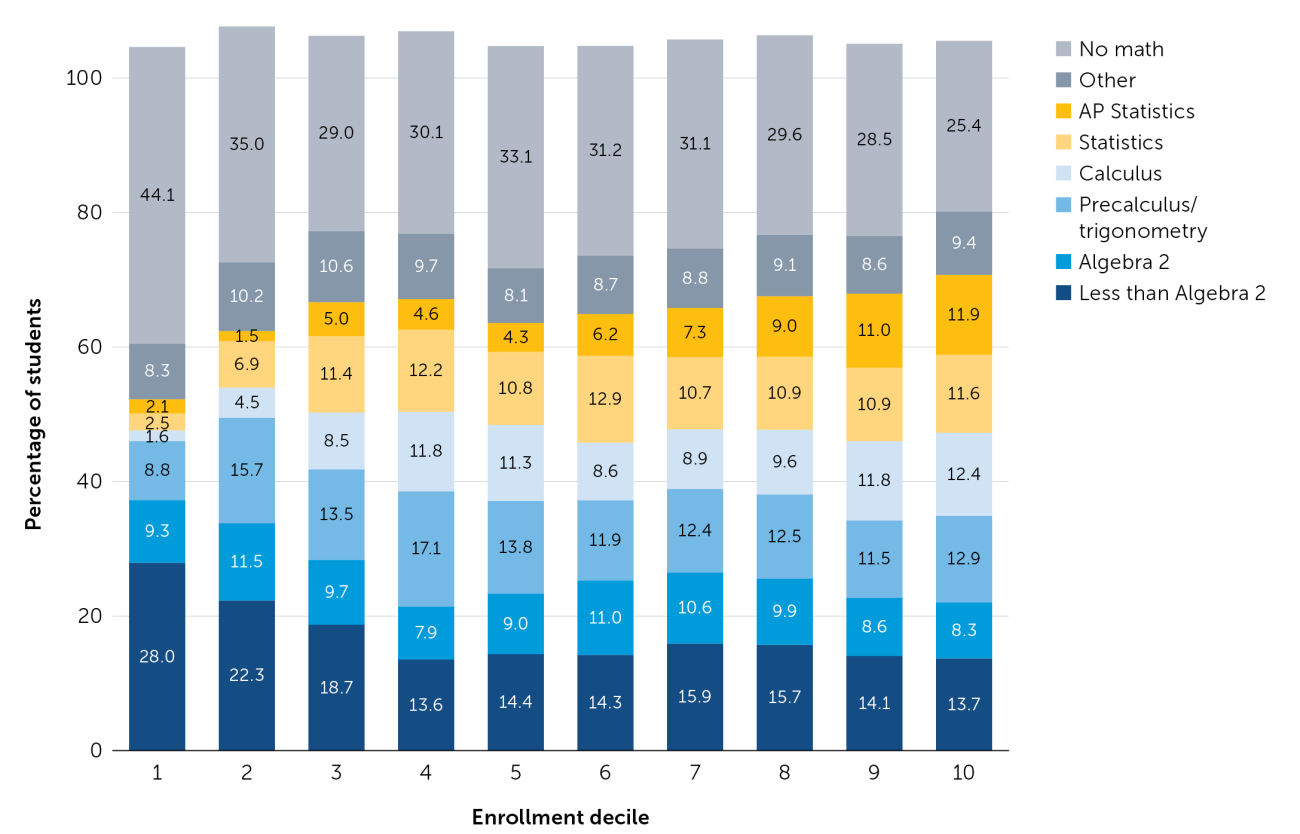
Note. The 2024 cohort is determined by enrollment in 12th grade on April 15, 2024. Enrollment deciles are based on the proportion of 2024 12th-grade cohorts categorized as enrolled at each school with 15 or more 12th graders. Cutoffs are at 35, 61, 97, 137, 220, 323, 397.5, 467.5, and 567. Only traditional school ownership codes are included (SOCs 65–67).
Compared to larger schools, the smallest 30 percent of schools (the first two deciles—those with 97 or fewer students) are more likely to have 12th-grade students enrolled in courses that students generally take before Algebra 2 and are unlikely to have seniors enrolled in calculus and AP Statistics. Larger schools (those in Deciles 3–10) have somewhat similar course enrollment for 12th-grade students. However, schools enrolling more 12th graders tend to have larger proportions of students taking AP Statistics.
Students in schools with higher shares of socioeconomically disadvantaged students were less likely to take advanced math in 12th grade.
The original report found that socioeconomically disadvantaged (SED) students are less likely to take advanced math during their senior year compared to their peers, and when they do take math, they are more likely to take lower-level math courses. Here, we examine differences in course-taking between schools by concentration of SED students, which can act as a proxy for school resources. In California, schools and districts with a high concentration of low-income students may receive additional state funding. Conversely, schools and districts with additional funding from outside resources (e.g., local taxes) may be able to attract teachers and provide smaller class sizes for students than schools with many disadvantaged students.47 We explore how math course-taking is related to the proportion of school need by examining math course-taking across ten deciles of socioeconomic disadvantage: schools with the smallest shares (less than 29 percent) of SED students in Decile 1 through schools with the largest shares (more than 94 percent) in Decile 10 (Figure 3).
Figure 3. Twelfth-Grade Math-Taking by School Socioeconomic Disadvantage Decile
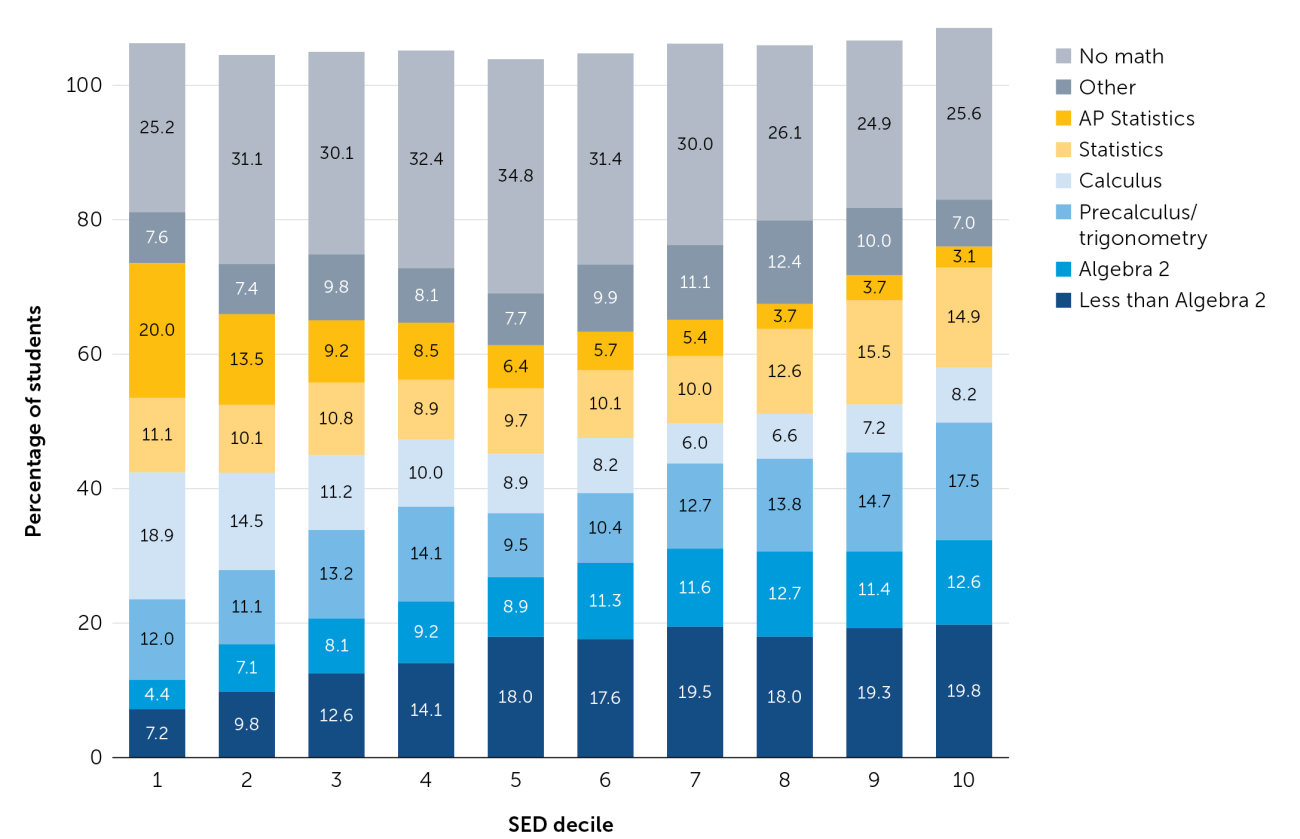
Note. SED = socioeconomic disadvantage. The 2024 cohort is determined by enrollment in 12th grade on April 15, 2024. SED deciles are based on the proportion of 2024 12th-grade cohorts categorized as SED at each school with 15 or more 12th graders. Cutoffs are at 0.29, 0.42, 0.52., 0.61, 0.70, 0.77, 0.83, 0.89, and 0.94. Only traditional school ownership codes are included (SOCs 65–67).
While the concentrations of SED students at schools with gains and losses in 12th-grade math enrollment are similar, in our most recent year of data, we find that there are important differences in math course enrollment at schools with different concentrations of SED students. Figure 3 shows 12th-grade math-taking in 2024 across schools with varying percentages of SED students (see Appendix Table A1 for details on student demographics across SED school deciles). When examining overall school-level math-taking, the figure depicts a characteristic “U” shape, previously documented by Asim et al.48 Notably, the schools with the highest level of 12th-grade math-taking are those with the highest and lowest proportions of SED students while schools in the middle deciles have lower 12th-grade math participation.
There are also important differences in the types of math classes seniors take at these schools. We find that the greater the concentration of SED students is in a given school, the greater the chance that seniors at the school are enrolling in courses typically taken before Algebra 2 or its equivalent, and the less likely seniors are to be enrolled in advanced math courses like calculus or AP Statistics. For example, at schools with the lowest proportion of SED students only 7.2 percent of 12th graders are enrolled in classes below Algebra 2, while schools with the highest proportions of SED students have almost 20 percent of students taking those courses as seniors. The inverse is true of calculus, where schools with the lowest proportion of SED students have almost one fifth of seniors enrolled in calculus while schools with more SED students have between 6 and 9 percent of their seniors enrolled in calculus.
Evidence also indicates that students at different types of schools tend to enroll in different kinds of statistics courses during their senior year. Statewide, student enrollment in (non-AP) statistics during 12th grade has increased substantially, from 6.4 percent in 2015 to 10.7 percent in 2024.49 At the school level, we find that in schools that have lower concentrations of SED students, 12th graders are more likely to enroll in AP Statistics, while in schools that have more SED students, 12th graders are less likely to enroll in AP Statistics. In fact, the 30 percent of schools with the highest share of SED students are most likely to have 12th-grade students enroll in non-AP statistics than in AP Statistics.
In most schools, the majority of students take courses that are necessary for eligibility to attend California public universities.
Students in California are required to pass Algebra 2 (or an equivalent course) with a C or better at some point in high school to be eligible for admission to California’s public 4-year universities. We examined math course-taking across the 4 years of high school to explore the proportion of students who reach this course-taking threshold using Algebra 2 enrollment as a proxy for completing the A–G math course requirements. While about three out of four high school students take Algebra 2 or an equivalent course by their senior year,50 this proportion varies substantially across schools.
The wave chart in Figure 4 includes 1,452 bars, each of which represents a traditional public high school in California51 and shows the percentage of students who ever enrolled in Algebra 2 (or an equivalent course), precalculus, or calculus at each school. In about half of schools, at least 80 percent of students enrolled in Algebra 2 or higher before graduation.
Figure 4. Distribution of Algebra 2 (or Equivalent) Course-Taking Rates
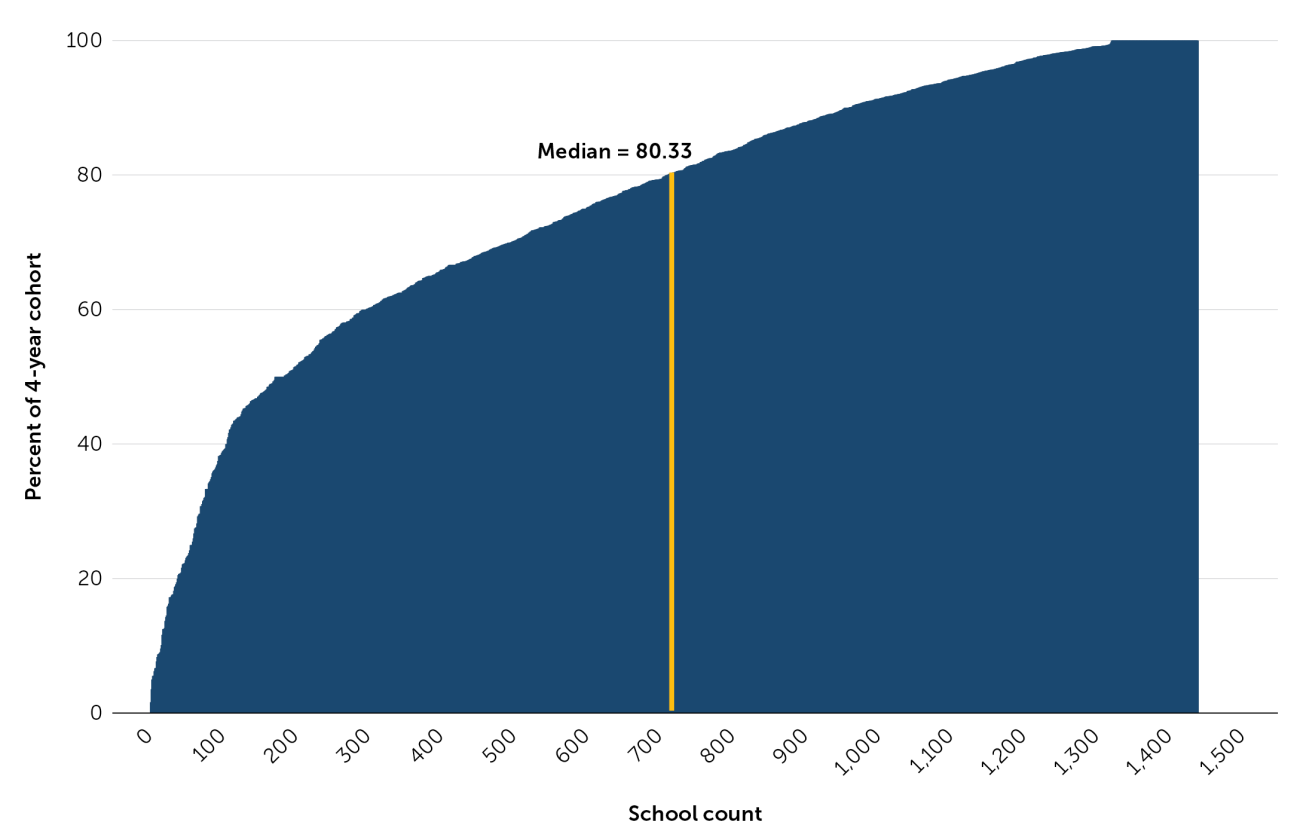
Note. The 2024 cohort is determined by enrollment in 12th grade on April 15, 2024. Only schools with traditional school ownership codes (SOCs 65–67) having 15 seniors with 4 years of course-completion data in 2024 are included.
At 119 schools (located on the far right of Figure 4), every student had enrolled in Algebra 2 (or an equivalent course) by their senior year. These schools were much smaller than most, with a median cohort size of 79 students in 2024, and many (66.4 percent) were charter schools. Students at these schools were more likely to be SED than the average student in our sample (74.3 percent vs. 61.2 percent).52 See Appendix Table A3 for more details on student demographics by 4-year course-taking patterns.
On the other hand, at 178 schools (those on the far left of Figure 4), fewer than half of the 12th-grade cohort completed Algebra 2 during high school. Schools with low Algebra 2 completion were also smaller than average, with a median enrollment of 79 seniors in 2024, and were more likely to be charter schools (66.9 percent). These schools had above-average overall rates of SED and English learner enrollment (73.8 percent vs. 61.2 percent and 12.5 percent vs. 10.1 percent, respectively). Students at these schools were also more likely to be Latinx and less likely to be Asian than the average student in our sample (61.3 percent vs. 55.1 percent and 4.0 percent vs. 10.8 percent, respectively).
Many schools have low—or even no—calculus enrollment.
More advanced math courses, including calculus, can increase a student’s competitiveness in the college admissions process.53 Students who take calculus are also more likely to graduate college and do so sooner than students who do not.54 However, whether a student enrolls in calculus (or any advanced math course) is a function of numerous individual- and school-level factors, including whether calculus is offered at a student’s school. Similar to the Algebra 2 chart presented in Figure 4, Figure 5 shows the percentage of students who ever enrolled in calculus at each California high school in 2024.
Figure 5. Distribution of Calculus Course-Taking Rates
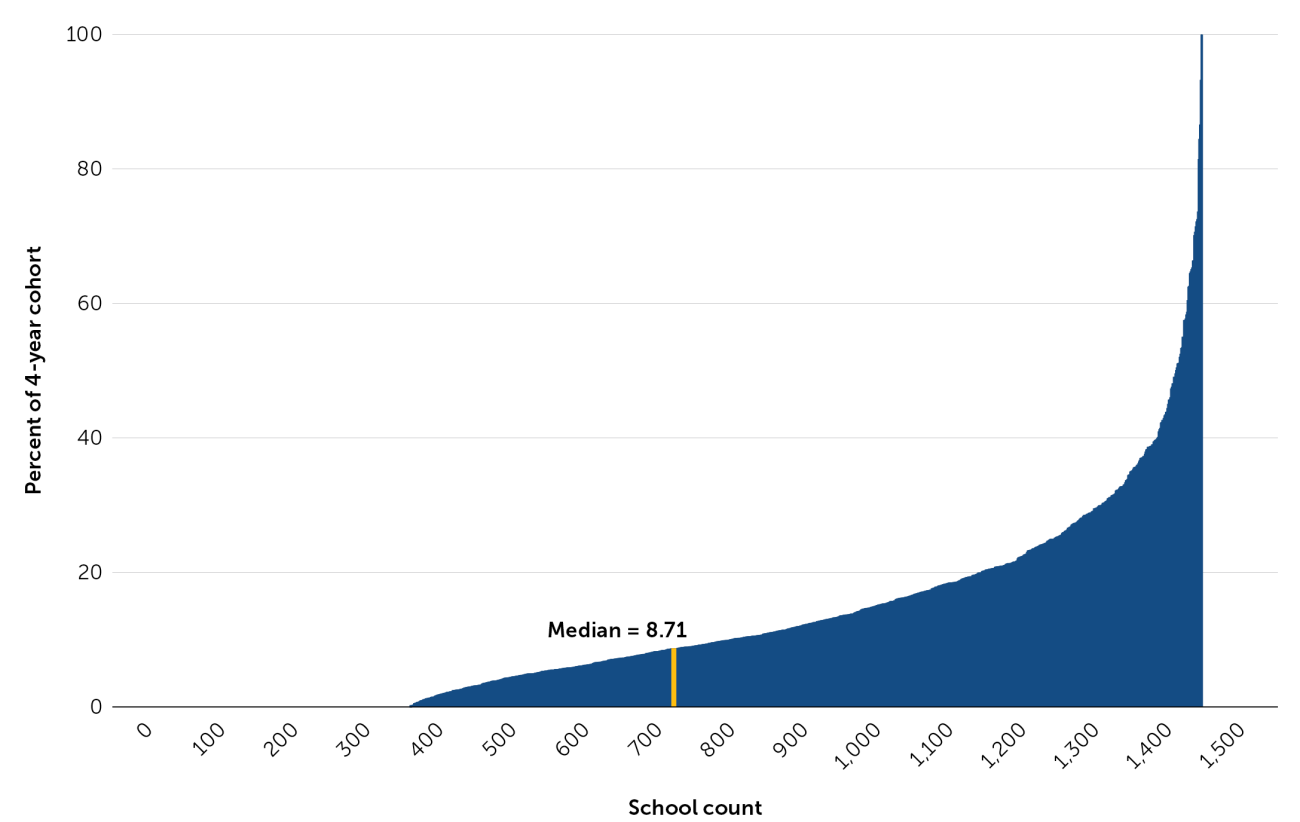
Note. The 2024 cohort is determined by enrollment in 12th grade on April 15, 2024. Only schools with traditional school ownership codes (SOCs 65–67) having 15 seniors with 4 years of course-completion data in 2024 are included.
Of the 1,452 schools where we could track at least 15 students across 4 years of coursework, 363 schools had no students enrolling in calculus during high school. While enrollment is an imperfect proxy, we can presume that these schools do not offer the course. Schools at which no students enrolled in calculus were more likely to be smaller schools and/or charter schools. Schools without calculus have a median enrollment of 60 students in 12th grade (compared to 240.5 at the median school in our sample), and nearly 62 percent are charter schools (compared to 29.4 percent of all schools in our sample). Alternatively, schools with calculus enrollment among the 2024 cohort are larger, with a median size of 346 students, and about 18.6 percent are charter schools.
Most schools in our sample offered calculus, although at a majority of schools (79 percent), less than 20 percent of students ever enrolled in calculus. This is unsurprising, given that the original report finds that only about 14 percent of students statewide enrolled in calculus during high school. In 2024, there were 36 schools where more than half of seniors enrolled in calculus at some point. These schools tended to be slightly larger than the average school in our sample, with a median of 332 seniors in 2024. These schools were slightly less likely to be charter schools than the average school (16.6 percent vs. 29.4 percent for the full sample), and they had fewer SED and English learner students than the average school (20 percent vs. 61.2 percent and 3.5 percent vs. 10.1 percent, respectively).
Course offerings have changed over the past decade.
So that we could better understand the role of schools in the broader trends of math course-taking documented in the original report and this brief, we explored changes in course offerings at the school level between 2015 and 2024 by examining the courses taken by any student enrolled in Grades 9–12 for each academic year (Figure 6).55 Courses typically taken before Algebra 2 are nearly universally offered at all high schools in the sample and are not shown. Findings reveal that Algebra 2, or an equivalent course, is nearly universally offered and has remained so across the last decade. Moreover, precalculus/trigonometry is also almost universally offered, and the percentage of schools offering those courses has changed only marginally during the past 10 years.
Figure 6. Observed Math Course Availability Over Time
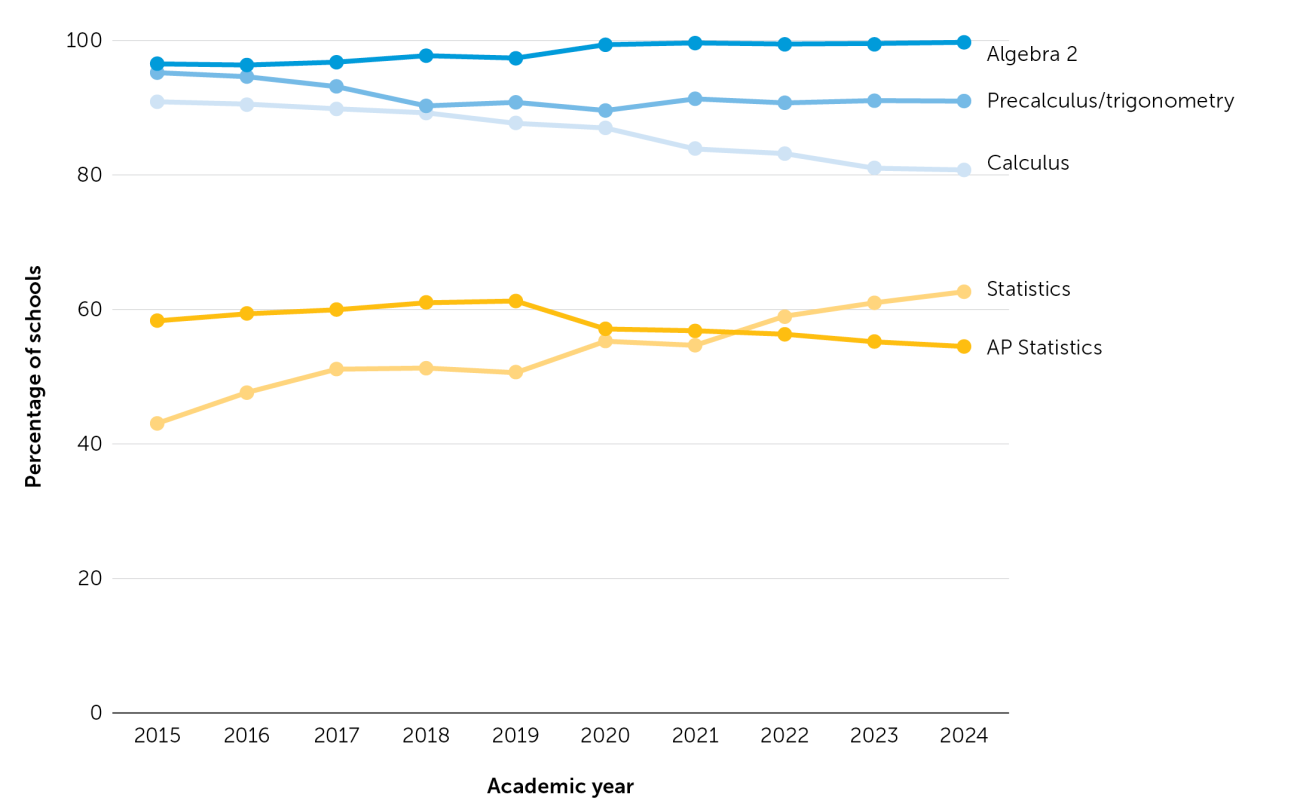
Note. Each dot represents the percentage of schools with at least one student in Grades 9–12 enrolled in each course category. This includes the 1,154 schools with traditional school ownership codes (SOCs 65–67) and at least 15 seniors with course data for each year from 2015 through 2024.
In contrast, there was a 9.5 percentage point decrease from 2015 to 2024 in the percentage of schools that offered a calculus course. This coincides with the original report’s findings of a decline of 3.6 percentage points in students enrolling in calculus over the last decade. This decline in calculus availability could be because more high school students enrolled in college courses—often called dual enrollment. We supplemented our analysis with data from the California Community Colleges Chancellor’s Office (CCCCO) to examine the dual enrollment behavior of students in California high schools. Of the 138 schools that stopped offering calculus between 2015 and 2024, 45 of those schools (one third) had zero students enrolling in math dual enrollment. Most schools (93) that stopped offering calculus had some dual enrollment in math. Prior to losing calculus, about 9.5 percent of students at those 93 schools enrolled in calculus, and in 2024, about 7.3 percent of students enrolled in some math dual enrollment, suggesting there may be a partial replacement. It is not likely that all of these dual enrollment courses are for calculus, but more research on the relationship between high school math enrollment and dual enrollment could yield important lessons for the state. The increased availability of the dual enrollment option may be mitigating the loss of calculus at some schools, but overall, fewer students have calculus available in their high schools.
More schools are now offering non-AP statistics courses, which mirrors the increase in statistics enrollment shown in the original report. About 63 percent of schools offered non-AP statistics in 2024, compared to about 43 percent in 2015. During the same period, the number of schools offering AP Statistics dropped slightly, from 58 percent to 54.5 percent. Of the schools that stopped offering AP Statistics, 34.6 percent began offering regular statistics instead. Combined, more schools now offer a statistics course than in 2015 (an increase from 74 percent to 81 percent), driven by the rise in non-AP statistics course offerings.
Teacher Impressions of 12th-Grade Math Enrollment
To explore some of the within-school factors that influence students’ math course-taking, we interviewed high school math teachers and district math coaches from six public school districts in California. Interviews affirmed that course selection can be overwhelming for students, especially at the point when classes branch into multiple options—typically after Integrated Math 3 or Algebra 2. Counselors and teachers play a critical role in helping students choose whether to enroll in math in 12th grade and which course(s) to take. In most cases, counselors helped students create 4-year course plans early in high school, revising them along the way and guiding students when it was time to register for 12th-grade courses. Teachers also helped students select which 12th-grade math courses to take, taking into account (a) the math pathways at their schools, (b) the math classes that students took in 11th grade, (c) students’ previous math grades, and (d) students’ plans for postsecondary education.
Postsecondary education plans played a major role in 12th-grade math enrollment. For example, in one district teachers and counselors advised those students who were preparing for college to enroll in AP Statistics or calculus. They advised students who were motivated to go to college but were nervous about taking math to enroll in a course like Quantitative Reasoning With Advanced Mathematical Topics, which is designed for students who are not ready or are not interested in the precalculus/ calculus pathway. Students who were not planning to go to college might take business finance or statistics—or perhaps no math at all—in 12th grade. Teachers emphasized that students ultimately decide for themselves which courses to take, and often their peers, their perceptions of teachers, or their relationships with teachers also influence their decisions.
Conclusion
Findings in this brief highlight the important role that schools play in whether students enroll in math during the senior year of high school. Between 2019 and 2024, two thirds of traditional public high schools saw a decline in senior-year math course-taking, with a typical school experiencing a decrease of around 4 percentage points. Yet, these downward trends were not universal. One third of high schools maintained or increased their 12th-grade math course-taking.
School and district policies likely play a role in whether students enroll in math during their senior year. For example, California requires only 2 years of math for high school graduation, but many districts mandate more—some aligned with the A–G specification of 3 years and some even requiring 4 years of math in high school.56 A school’s size and resources are also correlated with math enrollment. For example, the state’s smallest high schools tended to have the lowest 12th-grade math participation in 2024. Moreover, seniors at smaller schools and at schools with more SED students were more likely to enroll in courses below Algebra 2 (or its equivalent) and were less likely to enroll in calculus and AP Statistics. This may be due to limited availability of teachers and course offerings in the master schedules of the state’s smallest schools.57 Interviews with math educators indicate that a combination of factors influence students’ math course-taking, such as a student’s prior coursework, course availability, teacher and counselor recommendations based on students’ interests in college type and major, and student choice.
The cause of the statewide drop in mathematics course-taking is unclear. What is clear, however, is that schools of all sizes and demographic compositions had at least one fifth of their seniors not enrolling in math. The widespread nature of declining 12th-grade math enrollment may be cause for concern, especially if the trend continues.
Schools’ course-enrollment offerings, policies, and practices may also play an important role in whether a student enrolls in the kinds of courses that are linked to access and success in college. In 2024, about three quarters of students enrolled in Algebra 2 or a more advanced course at some point during high school—a rate that has remained consistent over the past decade.58 However, we find that in at least 178 schools in the state less than half of students ever enroll in the types of courses that would support their eligibility for California’s 4-year universities.
Course offerings also play a key role in whether students enroll in math and which courses they take. For example, the rising number of schools offering statistics courses during the past decade (from 43 percent to 63 percent of schools) coincides with an increase of students enrolling in (non-AP) statistics courses at the state level. Similarly, fewer schools offering a calculus course parallels the statewide decline in calculus enrollment (a drop of 9 percentage points).
School differences imply that not all students are given the same opportunities, particularly when it comes to the availability of advanced math courses like calculus and AP Statistics. There are more than 300 schools—many of which are small and/or serving higher proportions of SED students—that do not offer calculus. At the same time, some schools (often those that are larger and have fewer SED students) still enroll high numbers of students in both advanced math courses.
Uneven access to math courses, particularly advanced math courses, likely exacerbates inequality. Lack of access may create barriers for those students who want to apply for admission to 4-year colleges, prepare for STEM majors or other postsecondary education programs, and perform well in college. It is important to continue tracking these trends and consider how they may affect students as they transition into college and careers. The state should determine how and where to intervene to ensure that all students can take advantage of the opportunities that mathematics education can provide.
Larson, B., Jackson, J., Bennett, S. R., & Kurlaender, M. (2026, April). Subtraction and substitution: The role of schools in math course-taking [Policy brief]. Policy Analysis for California Education. https://edpolicyinca.org/publications/subtraction-and-substitution-schools
- 1
Dykeman, K., Kurlaender, M., Larson, B., & Reed, S. (2026, April). Subtraction and substitution: Shifts in high school math course-taking [Report]. Policy Analysis for California Education. edpolicyinca.org/publications/subtraction-and-substitution
- 2
Academic years are referenced using their spring terms; for example, the 2023–24 school year is referred to as 2024.
- 3
In this brief and in the main report (Dykeman et al., 2026), we often use Algebra 2 enrollment as a proxy for Area C (mathematics) completion in the A–G course sequence required for admission to the University of California and California State University systems. However, we cannot determine whether enrolled students passed the math course with a C or better, as required.
- 4
Aughinbaugh, A. (2012). The effects of high school math curriculum on college attendance: Evidence from the NLSY97. Economics of Education Review, 31(6), 861–870. doi.org/10.1016/j.econedurev.2012.06.004; Byun, S., Irvin, M. J., & Bell, B. A. (2015). Advanced math course taking: Effects on math achievement and college enrollment. The Journal of Experimental Education, 83(4), 439–468. doi.org/10.1080/00220973.2014.919570; Long, M. C., Conger, D., & Iatarola, P. (2012). Effects of high school course-taking on secondary and postsecondary success. American Educational Research Journal, 49(2), 285–322. doi.org/10.3102/0002831211431952; Rose, H., & Betts, J. R. (2001). Math matters: The links between high school curriculum, college graduation, and earnings. Public Policy Institute of California. ppic.org/wp-content/uploads/content/pubs/report/R_701JBR.pdf; Wainstein, L., Miller, C. E., Phillips, M., Yamashiro, K., & Melguizo, T. (2023, January). Twelfth grade math and college access [Report]. Los Angeles Education Research Initiative. laeri.luskin.ucla.edu/wp-content/uploads/sites/22/2022/12/LAERITwelfthGradeMathandCollegeAccessReport121522.pdf
- 5
Conger, D., Long, M. C., & Iatarola, P. (2009). Explaining race, poverty, and gender disparities in advanced course-taking. Journal of Policy Analysis and Management, 28(4), 555–576. jstor.org/stable/20685142
- 6
Adelman, C. (1999, June). Answers in the tool box: Academic intensity, attendance patterns and bachelor’s degree attainment (ED431363). ERIC. files.eric.ed.gov/fulltext/ED431363.pdf; Conger et al., 2009; Monk, D. H., & Haller, E. J. (1993). Predictors of high school academic course offerings: The role of school size. American Educational Research Journal, 30(1), 3–21. doi.org/10.3102/00028312030001003; Schreiber, J. B. (2002). Institutional and student factors and their influence on advanced mathematics achievement. The Journal of Educational Research, 95(5), 274–286. doi.org/10.1080/00220670209596601
- 7
See Dykeman et al. (2026) for a detailed description of the student-level data used in this brief.
- 8
We used school ownership codes (SOC) 65, 66, and 67, which represent K–12 schools, high schools, and single-district high schools. The 406,892 seniors at these 1,510 schools make up 91.3 percent of the 2024 12th-grade cohort constructed in Dykeman et al. (2026). The 8.7 percent of public school students not included in our sample attend other schools, such as continuation high schools, adult education centers, district community day schools, state special schools, juvenile court schools, and special education schools.
- 9
We measured the socioeconomic status of students using the socioeconomically disadvantaged (SED) variable as defined by the California Department of Education (CDE). The CDE counts a student as SED if the student is eligible for free or reduced-price lunch and/or the student does not have a parent who graduated from high school.
- 10
These categories are similar to those used in Asim, M., Kurlaender, M., & Reed Bennett, S. (2019, August). 12th grade course-taking and the distribution of opportunity for college readiness in mathematics [Report]. Policy Analysis for California Education. edpolicyinca.org/publications/12th-grade-course-taking-and-distribution-opportunity-college-readiness-mathematics; Reed Bennett, S., Merritt, C., & Kurlaender, M. (2023, February). 12th-grade math: An updated look at high school math course-taking in California [Infographic]. Policy Analysis for California Education. edpolicyinca.org/publications/12th-grade-math; and Dykeman et al., 2026.
- 11
It is worth noting that many schools with changes of more than 25 percentage points in absolute value also had large changes in student enrollment. Of these schools, the average absolute value of the percentage change in enrollment between 2019 and 2024 was over 135 percent (compared to about 24 percent at other schools).
- 12
The sample used for time-dependent analysis of course availability and 12th-grade math enrollment includes only the schools for which we have course-completion data for at least 15 high school seniors in each year from 2015 to 2024. These 1,154 schools enrolled 91.7 percent of the students from our initial sample of 1,510 schools in 2024 and 83.7 percent of the students in the sample used in Dykeman et al. (2026).
- 13
Individual schools often show relatively large fluctuations in 12th-grade math-taking from year to year. However, Figure 1 illustrates the overall downward trend across schools during the past 5 years.
- 14
See Appendix Figure A1 for the distribution of the changes in 12th-grade math course-taking rates between 2015 and 2019.
- 15
Fahle, E. M., & Reardon, S. F. (2018). How much do test scores vary among school districts? New estimates using population data, 2009–2015. Educational Researcher, 47(4), 221–234. doi.org/10.3102/0013189X18759524; Marks, G. N. (2006). Are between- and within-school differences in student performance largely due to socio-economic background? Evidence from 30 countries. Educational Research, 48(1), 21–40. doi.org/10.1080/00131880500498396
- 16
Legislative Analyst’s Office. (2011, May 2). How small is too small? An analysis of school district consolidation. lao.ca.gov/reports/2011/edu/district_consolidation/district_consolidation_050211.pdf
- 17
See Appendix Table A2 for details on student demographics across school enrollment deciles.
- 18
Hahnel, C., Zamarripa, S., & Gallagher, H. A. (2025, October). Excess revenue, unequal opportunity: Revisiting basic aid in the LCFF era [Report]. Policy Analysis for California Education. edpolicyinca.org/publications/excess-revenue-unequal-opportunity
- 19
Asim et al., 2019.
- 20
Dykeman et al., 2026.
- 21
Dykeman et al., 2026.
- 22
In this analysis, we restricted our sample to schools with at least 15 seniors and from which 4 years of course-taking data are available. This sample includes 1,452 schools that enrolled 99.1 percent of the students from our initial sample of 1,510 schools in 2024. These 1,452 schools enrolled 90.4 percent of the students in the 4-year sample used in Dykeman et al. (2026).
- 23
When describing the demographics of schools in our sample, we report median enrollment, the nonenrollment weighted percentage of schools that are charters, and enrollment-weighted mean demographics for SED status, English learner status, and race/ethnicity. See Appendix Tables A1–A4 for weighted and unweighted means and median summary statistics.
- 24
Burdman, P., Heller, R., & Baker, M. (2024, December). The limits of calculus: Revisiting the role of math education in college admissions [Report]. Just Equations. justequations.org/resource/the-limits-of-calculus-revisiting-the-role-of-math-education-in-college-admissions
- 25
Giani, M., Lyra, F., & Tyner, A. (2025, April 23). Calculus or statistics: Does it matter? Thomas B. Fordham Institute. fordhaminstitute.org/national/research/calculus-or-statistics-does-it-matter
- 26
We defined a school as “offering” a course category if at least one student assigned to that school in the CDE Cumulative Enrollment file appeared as enrolling in at least one term of that course in the CDE Course Completion file. This method of determining course “availability” or “offerings” has the advantage of reflecting students’ access to courses. If students with primary enrollment at School A take calculus at School B, then School A “offers” calculus. However, we cannot capture courses that were offered but did not reach satisfactory enrollment to run.
- 27
Gao, N. (2021, February). Does raising high school graduation requirements improve student outcomes? [Report]. Public Policy Institute of California. ppic.org/publication/does-raising-high-school-graduation-requirements-improve-student-outcomes
- 28
Legislative Analyst’s Office, 2011.
- 29
Dykeman et al., 2026.
- 30
Dykeman, K., Kurlaender, M., Larson, B., & Reed, S. (2026, April). Subtraction and substitution: Shifts in high school math course-taking [Report]. Policy Analysis for California Education. edpolicyinca.org/publications/subtraction-and-substitution
- 31
Academic years are referenced using their spring terms; for example, the 2023–24 school year is referred to as 2024.
- 32
In this brief and in the main report (Dykeman et al., 2026), we often use Algebra 2 enrollment as a proxy for Area C (mathematics) completion in the A–G course sequence required for admission to the University of California and California State University systems. However, we cannot determine whether enrolled students passed the math course with a C or better, as required.
- 33
Aughinbaugh, A. (2012). The effects of high school math curriculum on college attendance: Evidence from the NLSY97. Economics of Education Review, 31(6), 861–870. doi.org/10.1016/j.econedurev.2012.06.004; Byun, S., Irvin, M. J., & Bell, B. A. (2015). Advanced math course taking: Effects on math achievement and college enrollment. The Journal of Experimental Education, 83(4), 439–468. doi.org/10.1080/00220973.2014.919570; Long, M. C., Conger, D., & Iatarola, P. (2012). Effects of high school course-taking on secondary and postsecondary success. American Educational Research Journal, 49(2), 285–322. doi.org/10.3102/0002831211431952; Rose, H., & Betts, J. R. (2001). Math matters: The links between high school curriculum, college graduation, and earnings. Public Policy Institute of California. ppic.org/wp-content/uploads/content/pubs/report/R_701JBR.pdf; Wainstein, L., Miller, C. E., Phillips, M., Yamashiro, K., & Melguizo, T. (2023, January). Twelfth grade math and college access [Report]. Los Angeles Education Research Initiative. laeri.luskin.ucla.edu/wp-content/uploads/sites/22/2022/12/LAERITwelfthGradeMathandCollegeAccessReport121522.pdf
- 34
Conger, D., Long, M. C., & Iatarola, P. (2009). Explaining race, poverty, and gender disparities in advanced course-taking. Journal of Policy Analysis and Management, 28(4), 555–576. jstor.org/stable/20685142
- 35
Adelman, C. (1999, June). Answers in the tool box: Academic intensity, attendance patterns and bachelor’s degree attainment (ED431363). ERIC. files.eric.ed.gov/fulltext/ED431363.pdf; Conger et al., 2009; Monk, D. H., & Haller, E. J. (1993). Predictors of high school academic course offerings: The role of school size. American Educational Research Journal, 30(1), 3–21. doi.org/10.3102/00028312030001003; Schreiber, J. B. (2002). Institutional and student factors and their influence on advanced mathematics achievement. The Journal of Educational Research, 95(5), 274–286. doi.org/10.1080/00220670209596601
- 36
See Dykeman et al. (2026) for a detailed description of the student-level data used in this brief.
- 37
We used school ownership codes (SOC) 65, 66, and 67, which represent K–12 schools, high schools, and single-district high schools. The 406,892 seniors at these 1,510 schools make up 91.3 percent of the 2024 12th-grade cohort constructed in Dykeman et al. (2026). The 8.7 percent of public school students not included in our sample attend other schools, such as continuation high schools, adult education centers, district community day schools, state special schools, juvenile court schools, and special education schools.
- 38
We measured the socioeconomic status of students using the socioeconomically disadvantaged (SED) variable as defined by the California Department of Education (CDE). The CDE counts a student as SED if the student is eligible for free or reduced-price lunch and/or the student does not have a parent who graduated from high school.
- 39
These categories are similar to those used in Asim, M., Kurlaender, M., & Reed Bennett, S. (2019, August). 12th grade course-taking and the distribution of opportunity for college readiness in mathematics [Report]. Policy Analysis for California Education. edpolicyinca.org/publications/12th-grade-course-taking-and-distribution-opportunity-college-readiness-mathematics; Reed Bennett, S., Merritt, C., & Kurlaender, M. (2023, February). 12th-grade math: An updated look at high school math course-taking in California [Infographic]. Policy Analysis for California Education. edpolicyinca.org/publications/12th-grade-math; and Dykeman et al., 2026.
- 40
It is worth noting that many schools with changes of more than 25 percentage points in absolute value also had large changes in student enrollment. Of these schools, the average absolute value of the percentage change in enrollment between 2019 and 2024 was over 135 percent (compared to about 24 percent at other schools).
- 41
The sample used for time-dependent analysis of course availability and 12th-grade math enrollment includes only the schools for which we have course-completion data for at least 15 high school seniors in each year from 2015 to 2024. These 1,154 schools enrolled 91.7 percent of the students from our initial sample of 1,510 schools in 2024 and 83.7 percent of the students in the sample used in Dykeman et al. (2026).
- 42
Individual schools often show relatively large fluctuations in 12th-grade math-taking from year to year. However, Figure 1 illustrates the overall downward trend across schools during the past 5 years.
- 43
See Appendix Figure A1 for the distribution of the changes in 12th-grade math course-taking rates between 2015 and 2019.
- 44
Fahle, E. M., & Reardon, S. F. (2018). How much do test scores vary among school districts? New estimates using population data, 2009–2015. Educational Researcher, 47(4), 221–234. doi.org/10.3102/0013189X18759524; Marks, G. N. (2006). Are between- and within-school differences in student performance largely due to socio-economic background? Evidence from 30 countries. Educational Research, 48(1), 21–40. doi.org/10.1080/00131880500498396
- 45
Legislative Analyst’s Office. (2011, May 2). How small is too small? An analysis of school district consolidation. lao.ca.gov/reports/2011/edu/district_consolidation/district_consolidation_050211.pdf
- 46
See Appendix Table A2 for details on student demographics across school enrollment deciles.
- 47
Hahnel, C., Zamarripa, S., & Gallagher, H. A. (2025, October). Excess revenue, unequal opportunity: Revisiting basic aid in the LCFF era [Report]. Policy Analysis for California Education. edpolicyinca.org/publications/excess-revenue-unequal-opportunity
- 48
Asim et al., 2019.
- 49
Dykeman et al., 2026.
- 50
Dykeman et al., 2026.
- 51
In this analysis, we restricted our sample to schools with at least 15 seniors and from which 4 years of course-taking data are available. This sample includes 1,452 schools that enrolled 99.1 percent of the students from our initial sample of 1,510 schools in 2024. These 1,452 schools enrolled 90.4 percent of the students in the 4-year sample used in Dykeman et al. (2026).
- 52
When describing the demographics of schools in our sample, we report median enrollment, the nonenrollment weighted percentage of schools that are charters, and enrollment-weighted mean demographics for SED status, English learner status, and race/ethnicity. See Appendix Tables A1–A4 for weighted and unweighted means and median summary statistics.
- 53
Burdman, P., Heller, R., & Baker, M. (2024, December). The limits of calculus: Revisiting the role of math education in college admissions [Report]. Just Equations. justequations.org/resource/the-limits-of-calculus-revisiting-the-role-of-math-education-in-college-admissions
- 54
Giani, M., Lyra, F., & Tyner, A. (2025, April 23). Calculus or statistics: Does it matter? Thomas B. Fordham Institute. fordhaminstitute.org/national/research/calculus-or-statistics-does-it-matter
- 55
We defined a school as “offering” a course category if at least one student assigned to that school in the CDE Cumulative Enrollment file appeared as enrolling in at least one term of that course in the CDE Course Completion file. This method of determining course “availability” or “offerings” has the advantage of reflecting students’ access to courses. If students with primary enrollment at School A take calculus at School B, then School A “offers” calculus. However, we cannot capture courses that were offered but did not reach satisfactory enrollment to run.
- 56
Gao, N. (2021, February). Does raising high school graduation requirements improve student outcomes? [Report]. Public Policy Institute of California. ppic.org/publication/does-raising-high-school-graduation-requirements-improve-student-outcomes
- 57
Legislative Analyst’s Office, 2011.
- 58
Dykeman et al., 2026.