Unpacking California's Chronic Absence Crisis through 2024–25


Summary
Nearly 5 years after the COVID-19 pandemic, chronic absence remains far too high, both nationally and in California. Left unaddressed, chronic absence—defined as missing 10 percent or more of school for any reason—can translate into students having difficulties learning to read by Grade 3, reaching grade-level standards in middle school, and graduating from high school.1 Less frequently discussed is the impact on classrooms: When a significant proportion of students is often away from class, all students’ well-being and achievement can be affected. The resulting churn among students can make it more difficult for teachers to teach and can disrupt classroom norms.2 Reducing the elevated levels of chronic absence that California schools continue to experience is crucial to helping students catch up academically.3
Using data available from the California Department of Education and building on our 2023–24 analysis,4 we examine trends in California chronic absence through school year 2024–25. Although rates of chronic absence have continued to decrease since their peak in 2021–22, they remain alarmingly high, with only a slight decrease over the past year. Eight key facts indicate the urgent need for action and for ongoing attention to ensuring opportunities to learn for all students.
Chronic absence remains far above prepandemic levels and the rate of decline is slowing
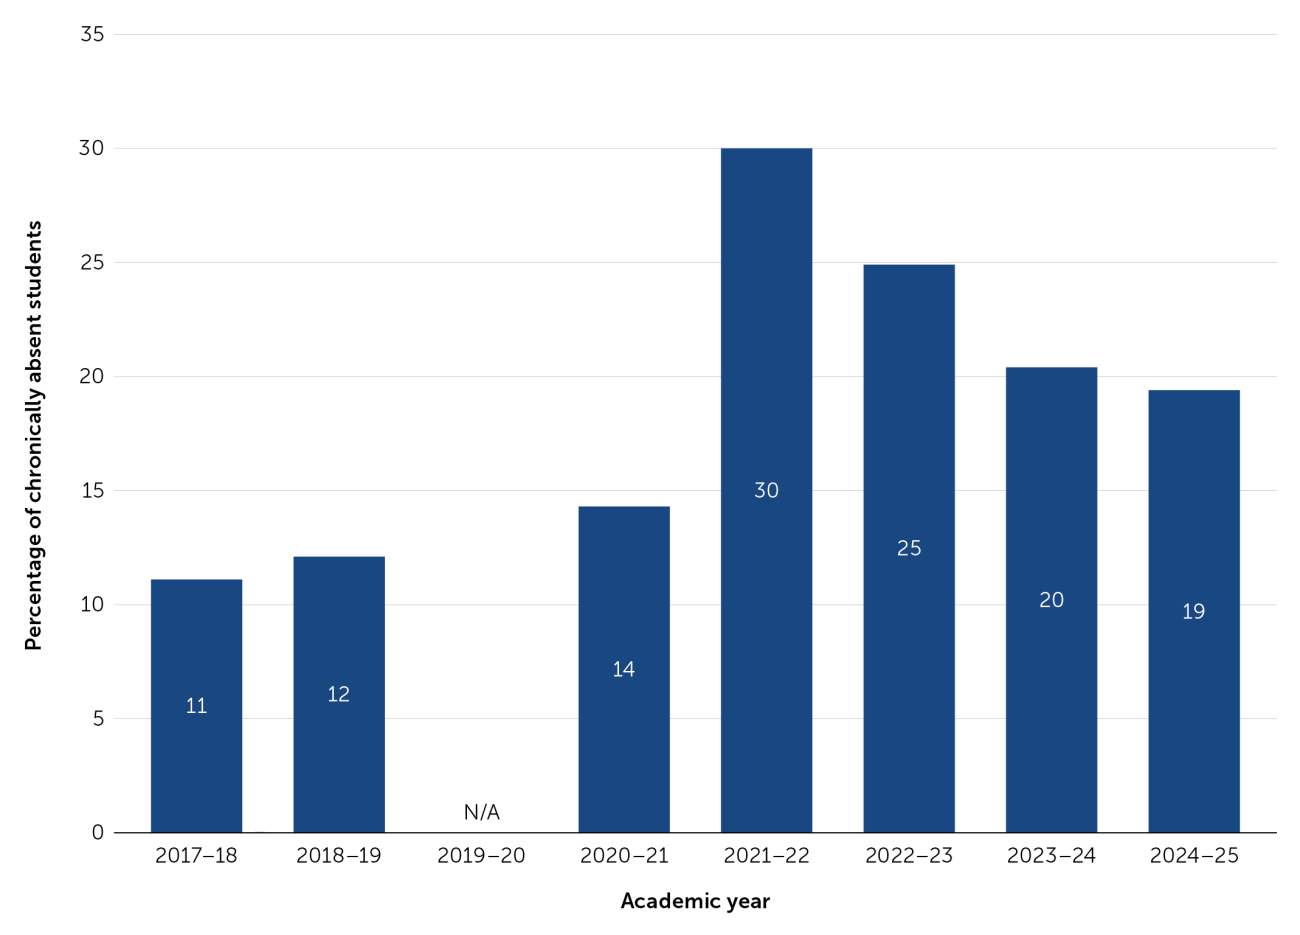
Chronic absence rates increased from 12.0 percent in 2018–19 to a high of 30.0 percent (1,799,735) in 2021–22 (Figure 1). In 2022–23, there was a decrease of 5.1 percentage points to a chronic absence rate of 24.9 percent (1,486,302 students), with a similar 4.5 point decrease in 2023–24 to 20.4 percent (1,216,528 students). In 2024–25, chronic absence decreased only slightly, to 19.4 percent (1,143,668 students)—still 7 percentage points above prepandemic levels. This slower rate of reduction reveals an even greater need for persistent and intentional investment in engaging students and families as well as in helping them overcome barriers to getting to school.
Figure 1. Statewide Rates in Chronic Absence From 2017–18 to 2024–25
Nearly half of California schools have high or extreme levels of chronic absence
The data show that the percentage of schools with high (20–29 percent) and extreme (30 percent or more) levels of chronic absence rose from 21 percent in 2018–19 to 75 percent in 2021–22, with a modest decrease to 68 percent in 2022–23, a more substantial decrease to 52 percent in 2023–24, and a much smaller decrease to 47 percent in 2024–25 (Figure 2). While this continued decrease is promising, the percentage of schools with high and extreme levels of chronic absence remains more than double the prepandemic rate.
Figure 2. Percentage of Schools With High and Extreme Levels of Chronic Absence From 2017–18 to 2024–25
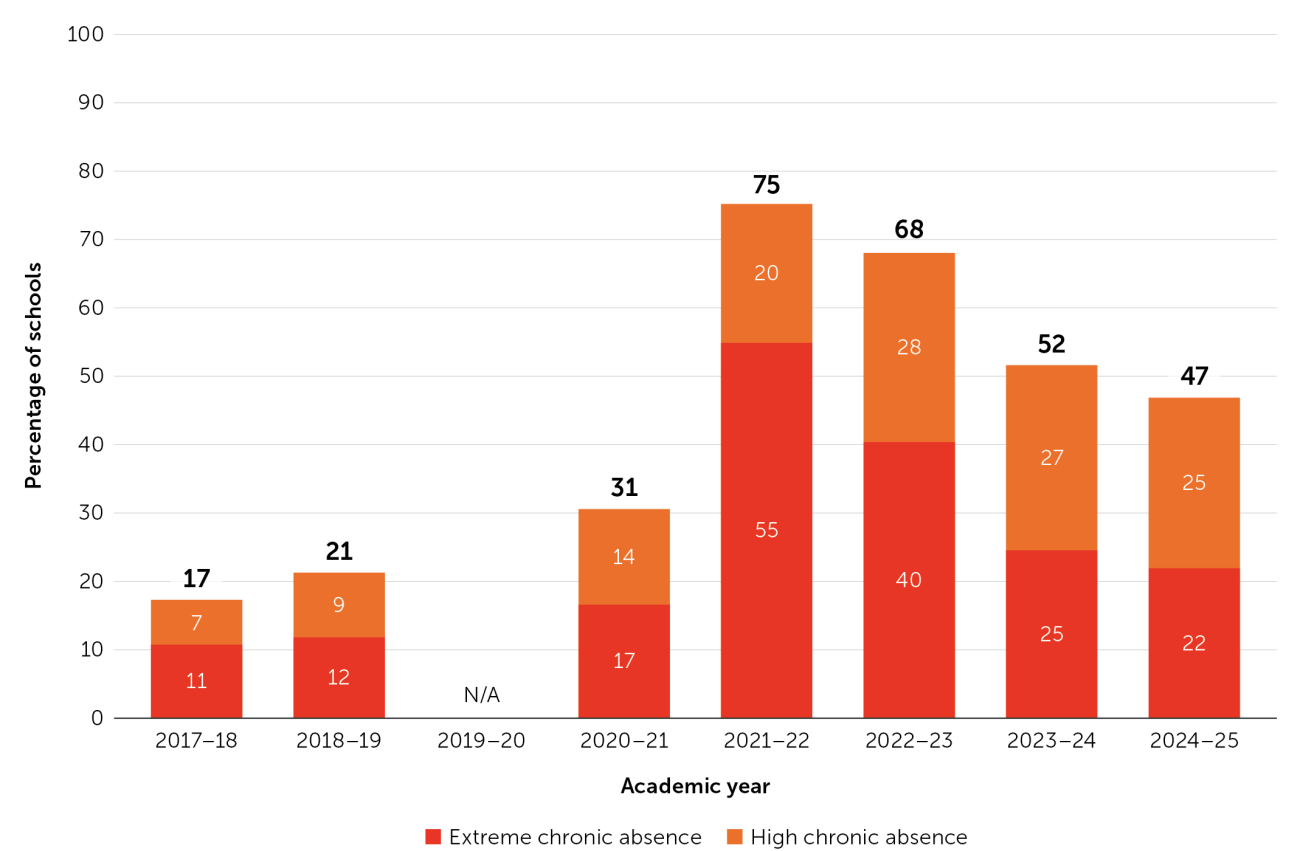
Note. Due to rounding, totals may not equal the sum of the displayed percentages.
Chronic absence is most pervasive in the highest poverty schools, where its consequences are also most severe
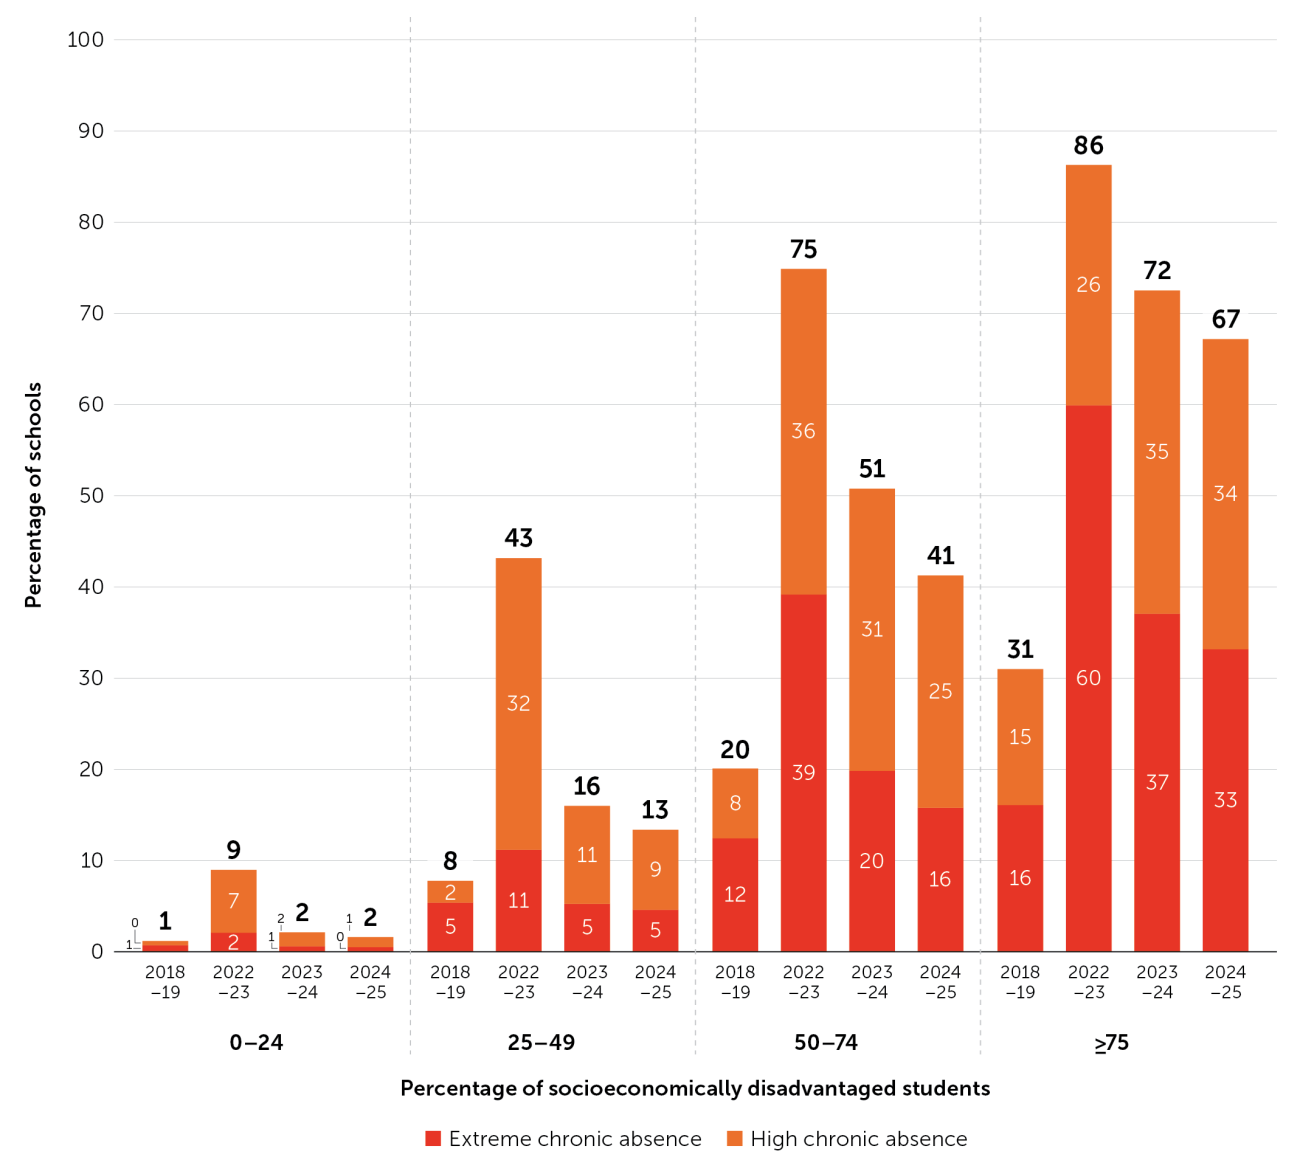
As the proportion of socioeconomically disadvantaged (SED) students in a school increases, so do the rates of chronic absence (Figure 3). In 2024–25, 67 percent of schools with 75 percent or more SED students experienced high or extreme levels of chronic absence compared to 2 percent of the most affluent schools (those serving 0–24 percent SED students). While the most affluent schools have almost recovered to prepandemic levels, the percentage of highest poverty schools still have more than twice the prepandemic levels of high or extreme chronic absence.
Unfortunately, chronic absence can be especially harmful for SED students, who are more likely to face multiple systemic barriers to regular attendance and have fewer resources to make up for lost learning opportunities in the classroom.5 This makes reducing chronic absence among lower income students imperative. Research from the Learning Policy Institute shows, however, that strategies like community schools can significantly improve attendance and engagement for students attending schools serving higher poverty communities.6
Figure 3. Schools With High and Extreme Chronic Absence Levels by Proportion of Socioeconomically Disadvantaged Students and Year
By count, the largest number of schools with high and extreme chronic absence served elementary students
In 2024–25, 2,350 California elementary schools had high and extreme rates of chronic absence (Figure 4). This is a significant improvement from 3,983 schools in 2022–23 and 2,708 schools in 2023–24—a total decline of 1,633 schools over 2 years and 358 in the past year. However, the large number of elementary schools still with high and extreme levels of chronic absence is particularly concerning given the potential long-term and costly consequences if young students fall behind academically and do not develop habits of regular attendance early in their school careers.7
Figure 4. Number of California Schools With High and Extreme Chronic Absence Levels by School Type and Year
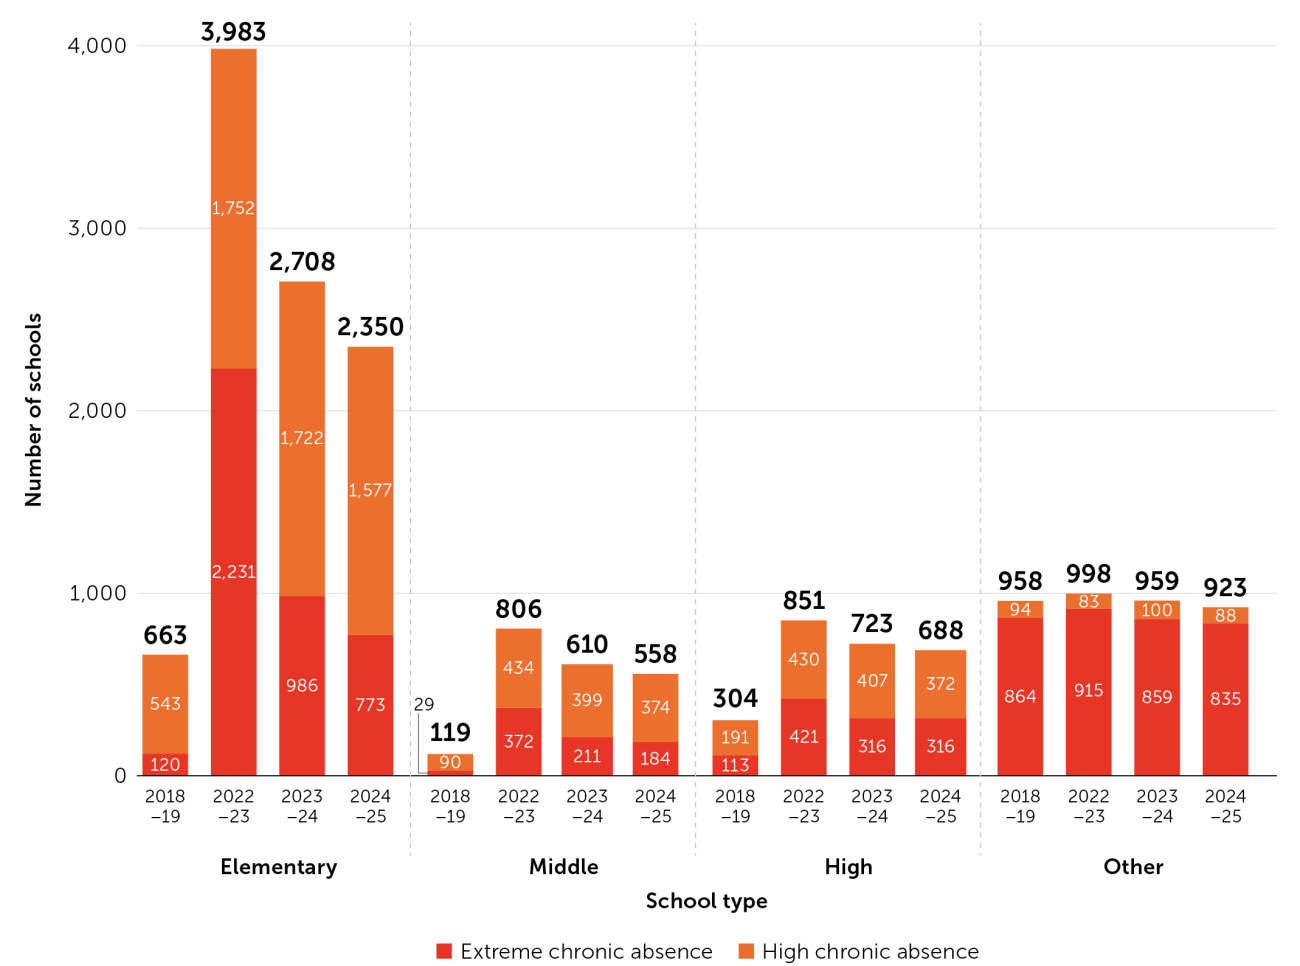
Note. Other = alternative schools of choice, continuation high schools, county community day schools, district community day schools, juvenile court schools, opportunity schools, special education schools, state special schools, and youth authority facilities.
By percentage, high and extreme chronic absence is more prevalent in secondary schools
In 2024–25, 43 percent of middle schools, 54 percent of high schools, and 79 percent of other schools (see note to Figure 5) had high or extreme levels of chronic absence (Figure 5). Although the rate for elementary schools is the lowest at 40 percent, elementary schools account for the largest number of schools with high and extreme chronic absence because they make up the largest share (59 percent) of schools statewide.
Figure 5. Percentage of California Schools With High and Extreme Chronic Absence Levels by School Type and Year
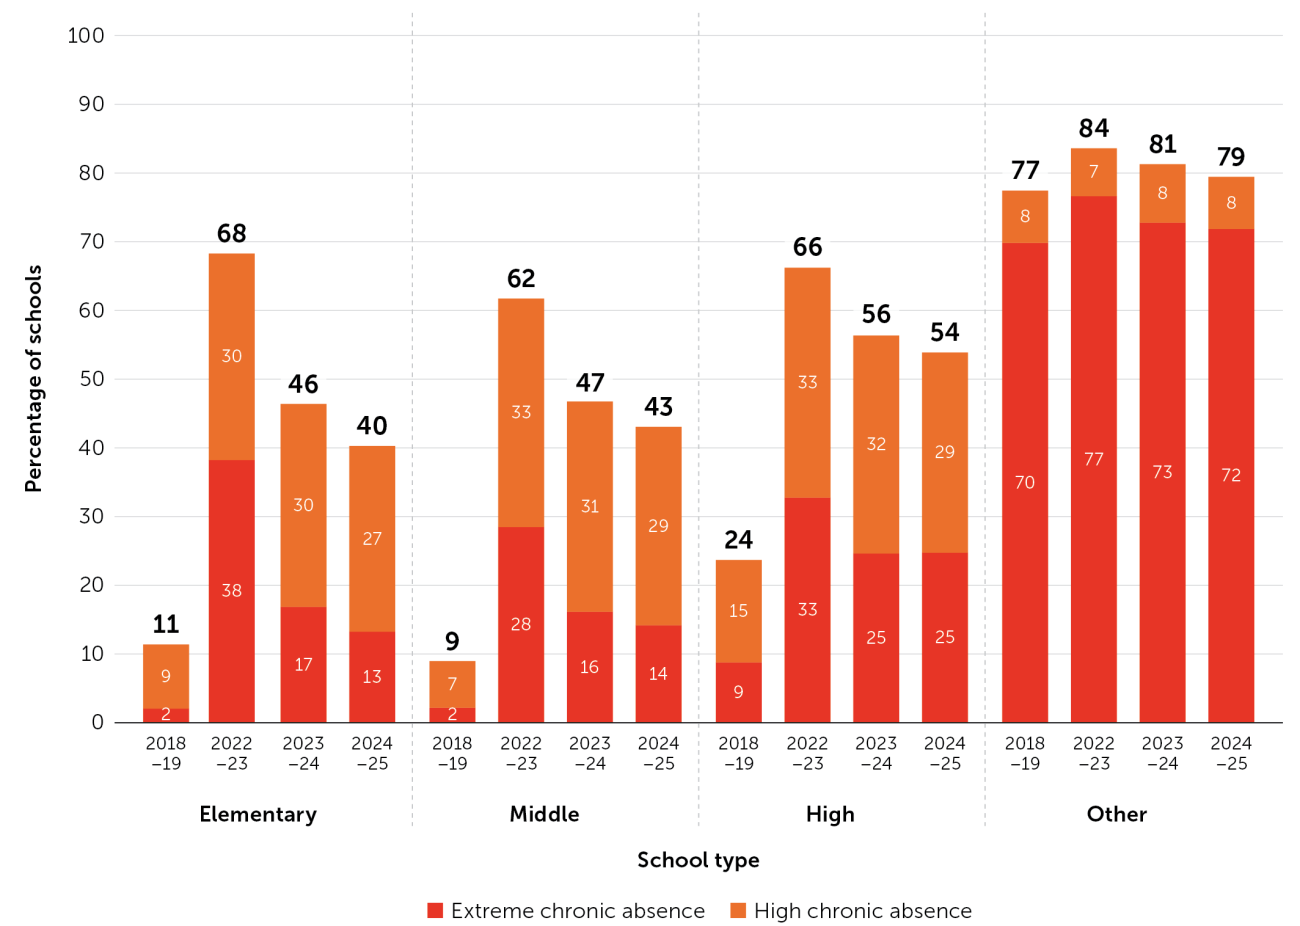
Note. Other = alternative schools of choice, continuation high schools, county community schools, district community day schools, juvenile court schools, opportunity schools, preschools, special education schools, state special schools, and youth authority facilities.
Chronic absence is highest in kindergarten and in high school, with high school rates being most difficult to improve
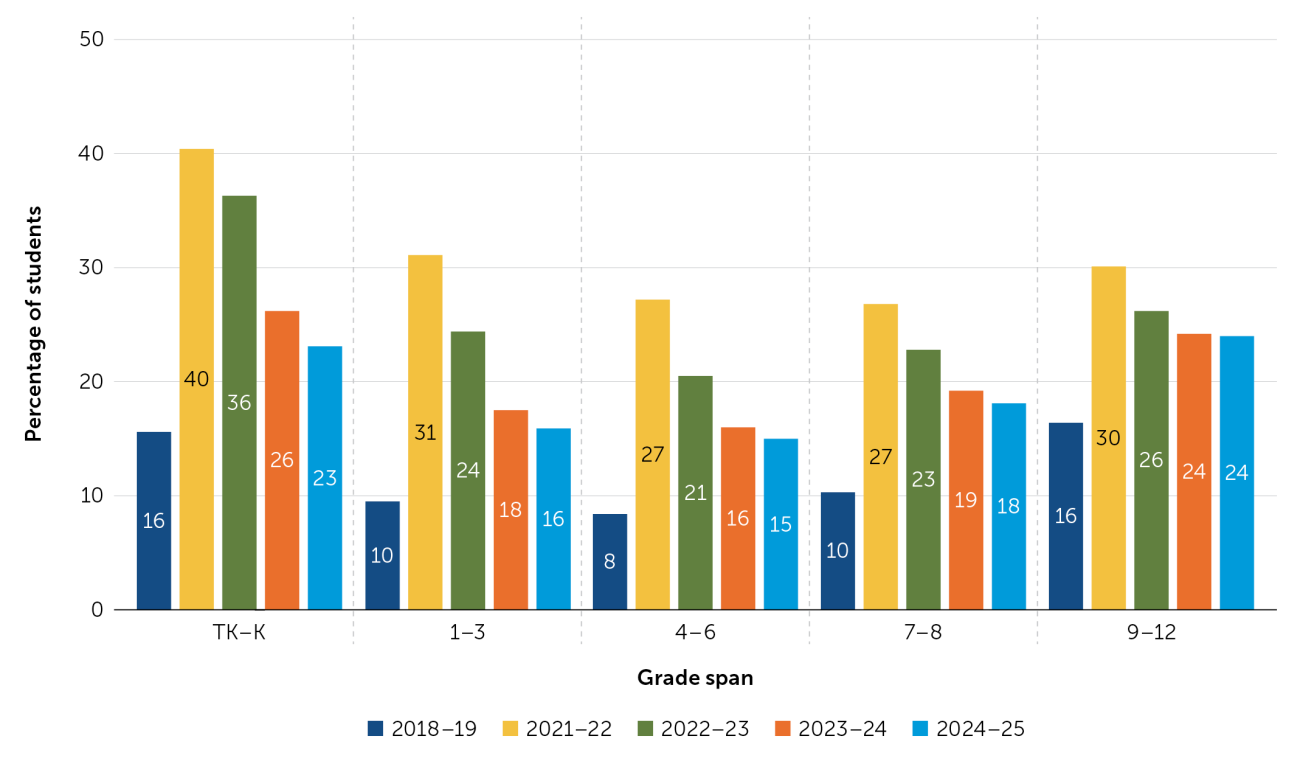
Prior to the pandemic, kindergarten (including transitional kindergarten) chronic absence was 16 percent—slightly lower than the chronic absence rate for high school. Kindergarten chronic absence more than doubled to 40 percent in 2021–22, dropped to 36 percent in 2022–23, further decreased to 26 percent in 2023–24, and decreased slightly to 23 percent in 2024–25 (Figure 6). Kindergarten attendance is critical because it establishes patterns that persist into the future. High school attendance is also vital because consistent classroom time has positive effects on learning and on graduation rates.8 High school rates of chronic absence, however, have experienced the smallest declines since the pandemic and as of 2024–25 remain slightly higher than kindergarten rates at 24 percent.
Figure 6. Chronic Absence Rates by Grade and Year
Despite small decreases for most groups, chronic absence remains especially high among particular student groups
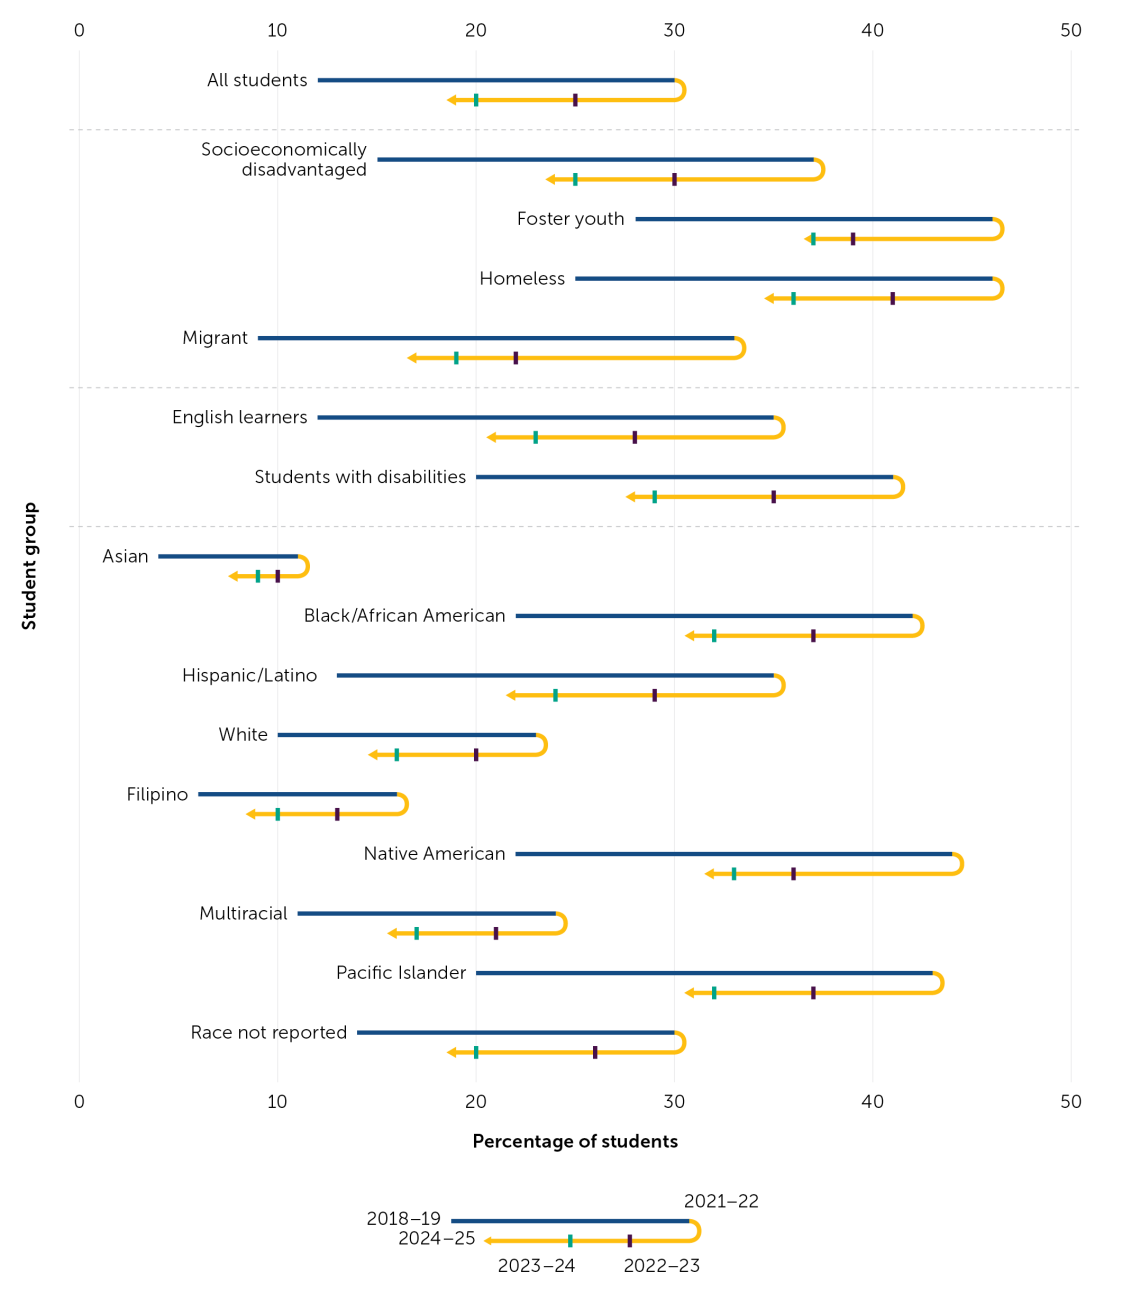
Figure 7 illustrates that certain groups of students experience much higher levels of chronic absence than others. Groups with the highest rates include students who are involved in the foster care system, experience homelessness, and/or identify as having a disability, as well as Native American, Black, and Pacific Islander students. Although recovery is slow, between 2023–24 and 2024–25, every student group saw a decline in the percentage of students who are chronically absent, with one exception: The group of youth in foster care saw an increase, if slight, of 0.3 percentage points.
Chronic absence both reflects and exacerbates multiple systemic barriers to getting to school these students may already experience. Such challenges to both students and families can include community issues (e.g., lack of access to health care, unreliable transportation, housing and food insecurity) as well as school issues (e.g., bullying, an unwelcoming school climate, biased disciplinary or attendance practices, or lack of meaningful, culturally relevant curricula). These difficulties can affect students’ ability to learn even when they are in class as well as cause them to fall farther behind when they miss valuable instruction time.
The number of students most likely to be chronically absent is one measure; however, it is also important to consider which racial and ethnic groups make up the largest number of chronically absent students. In California, Hispanic/Latino students are disproportionately represented; this group made up 65 percent of the chronically absent students in 2024–25 (739,261 students) and are 56 percent of the student population overall. The next largest numbers of chronically absent students by race in 2024–25 were White students (177,670) and Black students (91,217). White students accounted for 16 percent of chronically absent students while comprising 20 percent of total student enrollment. Black students accounted for 8 percent of chronically absent students while comprising 4.9 percent of overall student population.
Figure 7. Chronic Absence by Student Group
While chronic absence is a major challenge across the state, bright spots can be found in every type of locale in California
Every type of locale (city, suburb, town, and rural) has some level of high and extreme chronic absence, though levels are lower in suburban and rural schools. At the same time, there is a small percentage of schools with less chronic absence, as shown in Figure 8. These data indicate that all community types should recognize the importance of reducing rates of chronic absence, which can be improved in all locales. Data can be leveraged not only to identify potential bright spots but also to offer important insights about what works in specific local conditions. (The Attendance Works toolkit What Works in Our Community offers a guide that can be used for understanding these bright spots.)
Figure 8. Chronic Absence by Locale
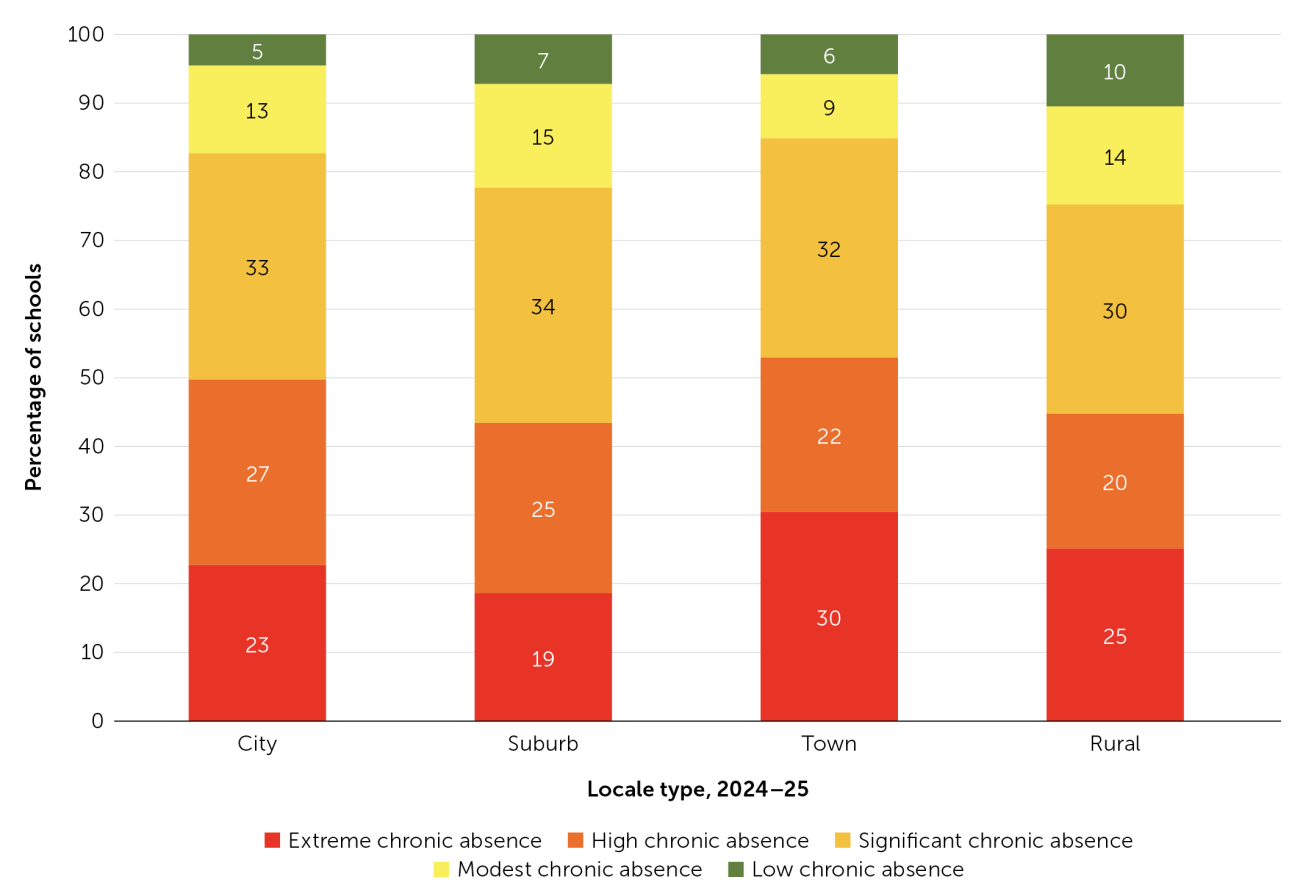
Note. Locale data were obtained from the National Center for Education Statistics (see nces.ed.gov/programs/edge/Geographic/LocaleBoundaries).
Conclusion
Continued levels of high and extreme chronic absence in California schools are a call to action for educators and leaders at all levels of the system to sustain and increase attention to student attendance and engagement. While the numbers continue to move in the right direction overall, the slower rate of progress in 2024–25 over the previous 2 years reveals the need for a still more intentional data-informed approach to addressing barriers that keep students from showing up to class. Expanding investments in engaging and meaningful learning experiences, particularly for high school students and students living in poverty, will have both short- and long-term impacts on our state’s children, youth, families, and future residents.
Chang, H. N., & Chavez, B. (2026, February). Unpacking California's chronic absence through 2024–25: Eight key facts [Infographic]. Policy Analysis for California Education. https://edpolicyinca.org/publications/unpacking-chronic-absence-through-2024-25
- 1
Balfanz, R., & Byrnes, V. (2012, May). The importance of being in school: A report on absenteeism in the nation’s public schools [Report]. Johns Hopkins University Center for Social Organization of Schools. new.every1graduates.org/wp-content/uploads/2012/05/FINALChronicAbsenteeismReport_May16.pdf; Chang, H. N., & Romero, M. (2008, September). Present, engaged, and accounted for: The critical importance of addressing chronic absence in the early grades [Report]. National Center for Children in Poverty. nccp.org/wp-content/uploads/2008/09/text_837.pdf; Ehrlich, S. B., Gwynne, J. A., Pareja, A. S., & Allensworth, E. M. (with Moore, P., Jagesic, S., & Sorice, E.). (2014, May). Preschool attendance in Chicago public schools: Relationships with learning outcomes and reasons for absences [Research report]. University of Chicago Consortium on Chicago School Research. files.eric.ed.gov/fulltext/ED553158.pdf; Utah Education Policy Center. (2012, July). Research brief: Chronic absenteeism. University of Utah. daqy2hvnfszx3.cloudfront.net/wp-content/uploads/sites/2/2017/05/23104652/ChronicAbsenteeismResearchBrief.pdf
- 2
May, H., Bailes, L. P., & Riser, D. M. (2025). Absenteeism and achievement in early elementary grades: A multilevel organizational analysis. Journal of Education for Students Placed at Risk, 30(4), 311–336. doi.org/10.1080/10824669.2024.2413483; Gottfried, M., & Ansari, A. (2022). Classrooms with high rates of absenteeism and individual success: Exploring students’ achievement, executive function, and socio-behavioral outcomes. Early Childhood Research Quarterly, 59, 215–227. doi.org/10.1016/j.ecresq.2021.11.008
- 3
Hill, L., & Prunty, E. (2023, April 4). Implications of chronic absenteeism for student learning. Public Policy Institute of California. ppic.org/blog/implications-of-chronic-absenteeism-for-student-learning
- 4
Chang, H. N., Chavez, B., & Hough, H. J. (2025, January). Unpacking California’s chronic absence crisis through 2023–24: Seven key facts [Infographic]. Policy Analysis for California Education. edpolicyinca.org/publications/unpacking-californias-chronic-absence-crisis-through-2023-24
- 5
Ready, D. D. (2010). Socioeconomic disadvantage, school attendance, and early cognitive development: The differential effects of school exposure. Sociology of Education, 83(4), 271–286. doi.org/10.1177/0038040710383520
- 6
Swain, W., Leung-Gagné, M., Maier, A., & Rubinstein, C. (2025, September 16). Community schools impact on student outcomes: Evidence from California [Report]. Learning Policy Institute. doi.org/10.54300/541.498
- 7
Ehrlich et al., 2014; Gottfried, M. A., & Ansari, A. (2021, March). Detailing new dangers: Linking kindergarten chronic absenteeism to long-term declines in executive functioning. Elementary School Journal, 121(3), 484–503. doi.org/10.1086/712426
- 8
Balfanz & Byrnes, 2012.