Published
Summary
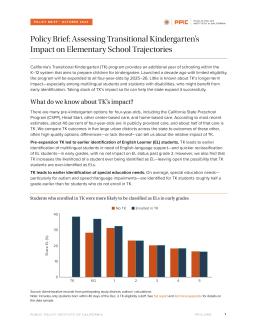
California’s Transitional Kindergarten (TK) program provides an additional year of schooling within the K–12 system that aims to prepare children for kindergarten. Launched a decade ago with limited eligibility, the program will be expanded to all four-year-olds by 2025–26. Little is known about TK’s longer-term impact—especially among multilingual students and students with disabilities, who might benefit from early identification. Taking stock of TK’s impact so far can help the state expand it successfully.
Published
Summary
The COVID-19 pandemic had a significant negative effect on the oral reading fluency (ORF) of US students in grades 2-3 in over 100 school districts, with students falling 30% behind expectations. While there was some recovery in the fall, it was insufficient to make up for the spring losses. The impact is particularly inequitable, with lower achieving schools being hit harder, and 10% of students not being assessed. Addressing accumulated learning losses and supporting struggling students is necessary.
Research to Guide Distance and Blended Instruction
Published
Summary
This suite of publications provides 10 recommendations based on the PACE report to help educators and district leaders provide high-quality instruction through distance and blended learning models in the 2020-21 school year. Despite the challenges of COVID-19, research can guide decisions about student learning and engagement. These recommendations can be used as a framework to prioritize quality instruction.
Characteristics, Outcomes, and Transitions
Published
Summary
The CORE districts studied characteristics, outcomes, and transitions of students with disabilities (SWDs). Specific learning disability was the most common type. Males, African Americans, English learners, and foster youth were overrepresented. Chronic absence was higher for SWDs with multiple disabilities. Most SWDs entered special education in K-4 and exited in grades 8-12. These results help identify who may need targeted support.
Published
Summary
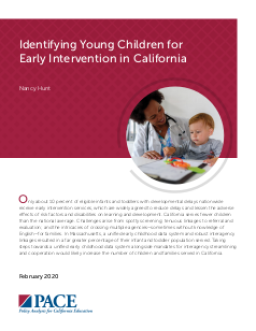
Only 10% of eligible infants and toddlers with developmental delays nationwide receive early intervention services, and CA serves fewer children than the national average. This is due to challenges such as spotty screening, tenuous linkages to referral and evaluation, and crossing multiple agencies. Massachusetts has a unified early childhood data system and robust interagency linkages, resulting in a greater percentage of their infant and toddler population served. Implementing a unified data system and interagency streamlining in CA could increase the number of children and families served.
Published
Summary
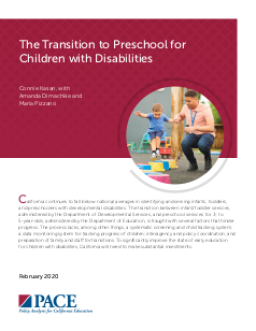
California is failing to identify and serve infants, toddlers, and preschoolers with developmental disabilities compared to national averages. The transition from infant/toddler services to preschool services is hindered by various factors such as the lack of a systematic screening and child tracking system, interagency coordination, and family/staff preparation for transitions. Significant investments are required to improve the state of early education for children with disabilities in California.
Published
Summary
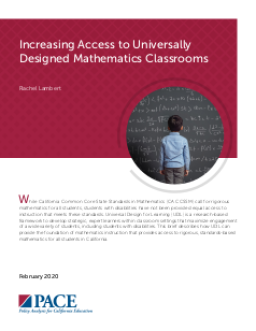
This brief explains that while the California Common Core State Standards in Mathematics require rigorous instruction for all students, those with disabilities do not always have equal access to this instruction. It recommends the use of Universal Design for Learning (UDL), a research-based framework that enables expert learners within classroom settings and maximizes engagement for all students, including those with disabilities, to provide access to rigorous, standards-based mathematics instruction for all students in California.
Published
Summary
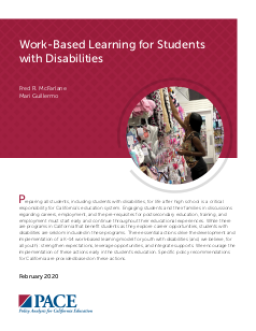
Students with disabilities should be included in programs that prepare them for life after high school. This can be achieved through a K-14 work-based learning model, which involves strengthening expectations, leveraging opportunities, and integrating supports. Early implementation of these actions is encouraged, along with specific policy recommendations for California.
Published
Summary
Preparing youth with disabilities for adulthood can be challenging, requiring additional supports and coordinated planning. Effective practices, such as family involvement, inclusion in general education, and interagency collaboration, can facilitate successful transitions to employment, postsecondary education, and community living. School districts must work with families, employers, and community agencies to implement these practices.

Published
Summary
The Learning Policy Institute analyzed the special education teacher workforce in California and found a severe teacher shortage that could harm students with disabilities who need expert teachers the most. The report identifies the causes of the shortage and potential reasons for teacher attrition. Evidence-based policy strategies are suggested to address the issue.
Published
Summary
The effectiveness of general education teachers in supporting students with learning disabilities is a concern, and there is little understanding of what components of teacher preparation programs relate to teachers’ perceptions of readiness. Two studies examined survey responses from preservice teachers in the University of California’s TPPs to identify the components of preservice preparation associated with perceived readiness. The study provides recommendations for policymakers and teacher educators to improve teacher preparation programs.
Published
Summary
This brief suggests recommendations for improving student outcomes by providing high quality and ongoing professional development to teachers, administrators, and school personnel. It identifies the achievement gap for diverse learners, including culturally and linguistically diverse students with disabilities, and offers strategies for integrating evidence-based practices into existing educational initiatives. Additionally, it outlines methods for improving the school-system climate to reduce barriers to providing and sustaining innovative training and intervention methods.
Published
Summary
This brief discusses how California's System of Support uses differentiated assistance (DA) to provide support to districts and boost student group performance levels. It analyzes the districts eligible for DA in 2019 based on their students with disabilities' (SWD) performance on State Priority Areas (SPAs) and indicators. The findings show that over half of the 333 eligible districts were driven by SWD performance in SPAs 4 (Pupil Achievement) and 5 (Pupil Engagement), highlighting intersectional challenges facing SWD that districts can address through their continuous improvement process.
Lessons from Other States
Published
Summary
This report discusses the challenges California faces in improving educational outcomes for students with disabilities (SWDs) and how inclusion in general education classrooms has positive benefits. It examines strategies used by Massachusetts, New Jersey, and Florida to improve inclusion rates and makes four recommendations for California, including implementing a data system, targeted support for districts with poor inclusion rates, and an inclusion tool for schools and districts to assess their practices.
Published
Summary
This brief highlights California's Multi-Tiered System of Supports (MTSS), which assists struggling students. The inadequate resourcing of Tier 2 services is nevertheless preventing progress in reading and math, as California ranks 38th in the nation. Categorical funding is necessary to provide additional personnel, such as instructional aides and clerical staff, to assist teachers with implementing MTSS effectively.
Published
Summary
This brief outlines the necessary steps to integrate care systems and improve outcomes for California's children. It suggests forming a statewide interagency leadership council and recommends policy reforms to promote collaboration, integration, and service delivery. The goal is to create a "Whole System" approach that integrates child-serving agencies and organizations. A full commitment from the state administration is needed to achieve these solutions at scale.
Views from the 2020 PACE/USC Rossier Poll
Published
Summary
In the run-up to 2020 elections, where do California voters stand on key education policy issues? This report examines findings and trends from the 2020 PACE/USC Rossier poll. Key findings include rising pessimism about California education and elected officials, continued concern about gun violence in schools and college affordability, and negative opinions about higher education. However, there is substantial support for increased spending, especially on teacher salaries.
California’s College Readiness Standards and Lessons from District Leaders
Published
Summary
This report summarizes efforts to align California's K-12 and postsecondary education systems to address disparities in educational attainment. Based on district leaders' interviews and quantitative data, the report finds that rigorous academic preparation is crucial to college success, and that participation and performance on college admissions exams are key indicators of college readiness. However, substantial inequality exists across all measures of readiness, and district leaders emphasize the importance of engaging families and the community in supporting postsecondary success.
Lessons from the CORE Districts
Published
Summary
This report examines how California's education sector is embracing continuous improvement over standards-based reform. The study presents six lessons learned from PACE and CORE Districts' collaboration on the topic, including the complexity of embedding continuous improvement processes into school norms and the need for deliberate steps to build a culture conducive to continuous improvement. The report provides implications for broader continuous work in California and beyond, with three case studies providing more detail on exemplary practices in two districts and one school.
Published
Summary
This report examines the stability of school effects on social-emotional learning (SEL) over two years in California's CORE districts. The correlations among school effects in the same grades across different years are positive but lower than those for math and ELA. While these effects measure real contributions to SEL, their low stability draws into question whether including them in school performance frameworks and systems would be beneficial.
Published
Summary
This report highlights the challenges that California’s school districts face due to increasing employee health benefit costs, including retiree benefits. Such costs strain district budgets, making it harder to address other priorities, like increasing teacher salaries or supporting disadvantaged students. The brief suggests that districts must navigate these costs more effectively, with potential help from state policymakers, to ensure they are sustainable and not left as unfunded liabilities.

Evidence from the 2019 PACE/USC Rossier Voter Poll
Published
Summary
This brief analyzes the 2018 update of the California School Dashboard, examining improvements and areas for continued enhancement. Using data from the 2019 PACE/USC Rossier poll, the author characterizes use of and support for the Dashboard, finding low use, equity gaps, but high support and preference for the new Dashboard.
Published
Summary
This report details where California public high school students attend college and how college attendance and destinations vary by county. The report was created to fill the information gap on the college destinations of high school graduates in California. The data set assembled includes three recent cohorts of public high school students matched with college enrollment data from the National Student Clearinghouse.
Learning from the CORE Data Collaborative
Published
Summary
Effective data use is crucial for continuous improvement, but there is confusion about how it differs from data use for other purposes. This report explains what data are most useful for continuous improvement and presents a case study of how the CORE data collaborative uses a multiple-measures approach to support decision-making.
A Review of Getting Down to Facts II Findings
Published
Summary
Getting Down to Facts II reveals California's limited progress in reducing achievement and opportunity gaps for Black, Latino, low-income, and/or English language learners. The state's education reforms have relied on good intentions rather than specific accountability and enforcement, resulting in below national average outcomes. This paper examines equity in teaching, learning, finance, and accountability and concludes with a broader conception of equity for the future, whole child equity, to tackle this nearly intractable problem.